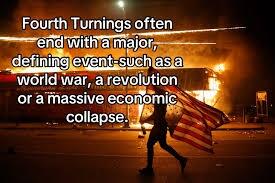
Jim Quinn Warns "We've Already Entered This Fourth Turning's Global War..."
Authored by Jim Quinn via The Bruning Platform blog,
“THESE are the times that try men’s souls. The summer soldier and the sunshine patriot will, in this crisis, shrink from the service of their country; but he that stands by it now, deserves the love and thanks of man and woman. Tyranny, like hell, is not easily conquered; yet we have this consolation with us, that the harder the conflict, the more glorious the triumph.” – Thomas Paine – The American Crisis
“At worst, should at least one desperate country resort to WMDs, the outcome of a great-power war could prove to be even more devastating than that of a civil war. The toll could be almost unimaginable – with multiple cities destroyed, many millions killed, and many tens of millions displaced – all perhaps triggered by some ill-fated combination of the wrong leader making the wrong choice at the wrong time.” – Neil Howe – The Fourth Turning Is Here
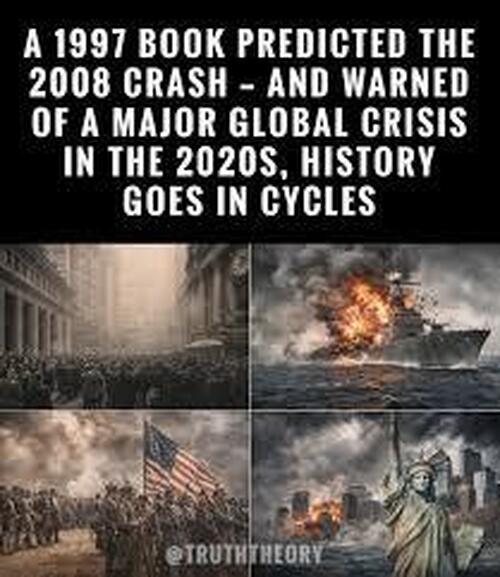
My previous two articles about this Fourth Turning: Prophets, Nomads and a Fourth Turning Accelerating Towards a Bloody Climax in April 2025 and War Phase of This Fourth Turning Has Arrived in July 2025 were progressively more pessimistic about the course of coming events, and things have proceeded along a precarious path towards our own rendezvous with destiny/tragedy. We are closing in on the 18th anniversary of the start of this Crisis epoch in September. The previous Great Depression/WWII Fourth Turning came to its climactic bloody conclusion after seventeen years, but this period of upheaval and disorder looks like it will extend into the early 2030s, just as Strauss & Howe predicted.
After rereading the prior two articles, I was shocked at how drastically the world has transformed in the space of one year and how the chief facilitator for driving events – Donald Trump – has hugely reversed his stated positions from the outset of his presidency. During the first 18 months of his 2nd term in office, Trump has done the exact opposite of what he promised and gone to war with the people most responsible for getting him elected: Elon Musk, Tucker Carlson, Marjorie Taylor Greene, Thomas Massie, among others. The question is whether this was always his plan, or has he been coerced/bribed by Israel using Epstein file revelations.
At first, I was cautiously optimistic Trump had learned some hard lessons from his first term personnel debacles and the Deep State conspiracy to derail his presidency, along with the provable stealing of the 2020 election through mail-in ballot fraud, rigged voting machines, and judicial interference, resulting in the insertion of a dementia ridden basement dummy as a Potemkin president.
Trump staffed his new administration with what appeared to be loyalists, committed to revealing the truth about the Russiagate conspiracy, the 2020 stolen election, the Epstein files, FBI/CIA coup participants, the Soros/Biden/Clinton/Obama purposeful initiation and funding of the 3rd world invasion of our country to steal elections and initiate economic collapse, USAID as the funder of NGOs committed to destroying our society, the J6 Committee malfeasance, and the massive government fraud in all welfare programs at the Federal and State levels.
With Musk’s DOGE revelations and promises of $2 trillion in savings, the early months of Trump’s presidency seemed promising. He fulfilled his guarantee to shut the border and stopped the hordes of low IQ 3rd world dirtbags from invading our country and overwhelming our social welfare system. With much fanfare (and TV commercials), Kristi Noem began deporting thousands of illegals on a daily basis. Pam Bondi and Kash Patel declared they had all the Epstein files and would be releasing them in their criminal entirety.

But right-wing influencers were given binders with no new Epstein revelations in a February White House PR event. Something started to smell fishy. Trump acted like a Middle East peacemaker, with rhetoric about ending the Gaza genocide and turning it into resort for his wealthy cronies. He held multiple talks with Putin and Zelensky. It looked like ending the Ukraine war and delivering peace on earth might be his legacy.
By June, Trump’s presidency began to unravel, and he started reneging on his promises, having a major falling out with Musk over his Big Beautiful Bloated Bill, and began his infatuation with his Boss Bibi, who told him what to do and when to do it. Trump’s bombast about reducing the national debt and balancing the budget was put to the test with his first budget bill.
In my previous article I had stated it would require tremendous courage on the part of Trump and his congressional majority to institute the billions in DOGE cuts, as it is only government waste, Fed debt creation, and consumers spending money they don’t have on shit they don’t need at 20% interest provided by the Wall Street cabal, that keeps this U.S. Titanic of debt economy afloat. Cutting government spending would guarantee a recession. As expected, cowardly politicians, bought off by special interests, and driven by re-election desires, had no interest in cutting a dime of government spending.

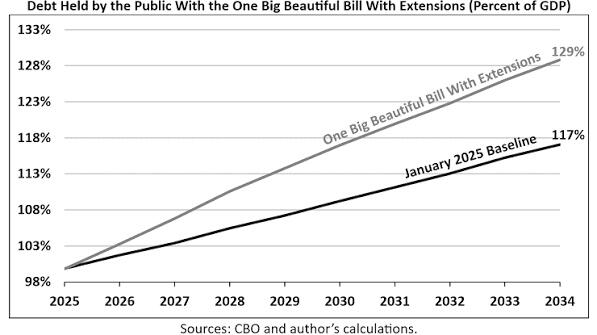
Trump made no effort to reduce the spending earmarked in the Big Beautiful Bill, going along with the continued death march of debt creation. Prior to the bill, the 10-Year CBO forecast was for the national debt to increase by $21 trillion, so essentially accelerating towards fiscal disaster. Trump’s BBB added another $5 trillion to that farcical figure, not exactly “cutting” the budget. The national debt has gone from $36.2 trillion to $39.5 trillion in the first 1.5 years of Trump’s reign of debt.
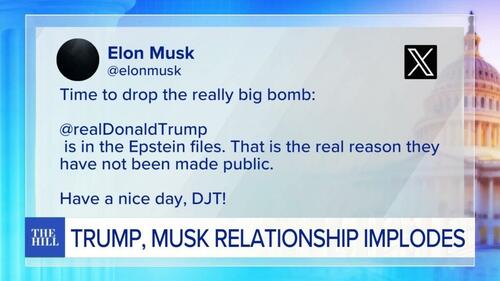
With the uniparty in agreement, $2 trillion annual deficits are locked in until the debt Ponzi implodes. The MAGA army of maff challenged NPCs obediently applauded for Trump’s 5D chess genius. Musk realized his entire DOGE effort was nothing more than window dressing for Trump to get elected. They had a very public clash, with nasty personal attacks, and a miffed and misled Musk revealed why Trump was not allowing the Epstein files to be released.
This was the first crack in the MAGA narrative dam, while setting in motion the future of full catastrophic collapse over the remainder of his term. His fiscal promises of $2,000 DOGE rebates, $2,000 Tariff rebates, lower inflation, and manufacturing plants and jobs returning to America (we’ve lost 75,000 manufacturing jobs since Trump’s inauguration), have proven to be fake news. After ICE killed a couple of protestors, Trump basically threw in the towel and said he wasn’t going to deport the millions of illegal immigrant criminals. Somebody has to pick the lettuce and do the housework of the Epstein class.
But at least we are getting hundreds of electricity and water sucking surveillance centers disguised as data centers, along with hundreds of thousands of flock cameras, violating our 4th Amendment rights 24 hours a day on behalf of the surveillance state. All of Trump’s treachery since June of 2025 appears to be related to the Epstein files and Israel controlling Trump through blackmail, related to his appearance in those files. After railing for years about the Epstein files cover-up, Trump suddenly had no interest in releasing anything. It was suddenly a Democratic hoax. Only a guilty person would make such a dramatic turnabout.
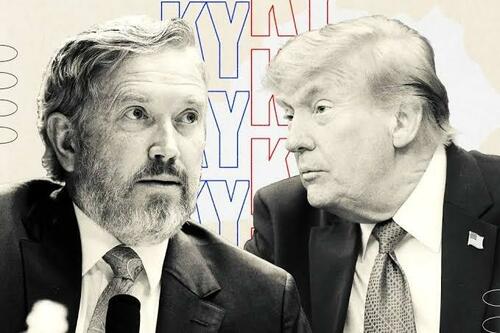
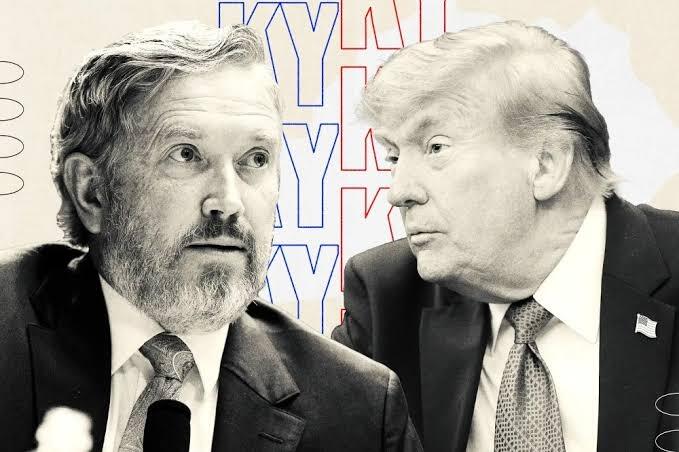
The stonewalling was overcome by Thomas Massie’s Epstein Files Transparency Act, introduced in July 2025, requiring un-redacted files by the FBI to be released. Trump immediately went to war against Massie, utilizing his Israeli billionaire donors, led by Miriam Adelson, to spend over $30 million to defeat him in his primary. Not supporting Zionist genocides, undeclared wars on behalf of Israel and the military industrial complex, $2 trillion deficits, the surveillance state, and child raping billionaires, make you an enemy of the Trump controlled state. After declaring no new wars during his campaign, Trump allowed Bibi to lure him into spending billions to bomb Iran’s nuclear facilities during their 12-day war in June 2025.
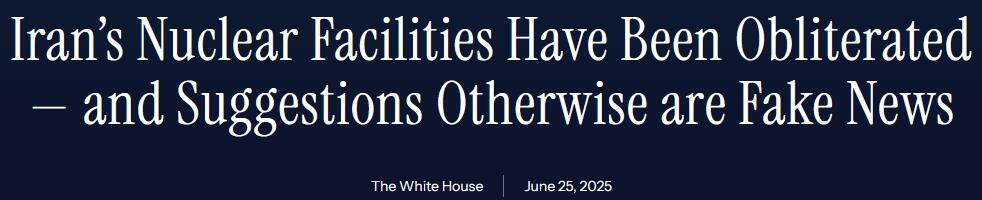
The bloviator in chief, and his low IQ Fox News Secretary of Defense declared Iran’s nuclear bomb ambitions dead. The White House website was unequivocal in declaring complete and total obliteration of Iran’s supposed nuclear bomb ambitions. Trump saved the world from the imminent nuclear attack on Israel by Iran, just as Bibi had been warning for the last 20 years. This declaration of obliteration happened just over a year ago. What happened between June of 2025 and February of 2026 to change the narrative back to Iran weeks away from having a nuclear bomb? Was Trump lying in June or in February? Since 75% of everything he says is lies, it’s a tough nut to crack.

Despite Trump’s obvious abandonment of his MAGA campaign pledges within several months of ascending to power, CPI was 2.7% by December 2025, GDP was 2% for 2025 despite a government shutdown, mortgage rates had dropped to 6%, oil was $57 a barrel and most people were paying less than $3 a gallon for gas, Trump and Putin met in Alaska and it looked like the Ukraine War might wind down, but this proved to just be a phony interlude in this Fourth Turning Crisis cycle of catastrophe. As soon as the calendar flipped the page to 2026, Trump decided to light the fuse on this global tinderbox of regional animosity, religious hatred, and battle for currency dominance, military supremacy, and control of global oil supplies.
After blowing up dozens of speedboats, 1,300 miles from the U.S. mainland, supposedly trafficking drugs from Venezuela, Trump decided to kidnap the sitting president of Venezuela on January 3, based on laughable drug trafficking charges, considering the CIA has trafficked more drugs into the U.S. than any organization in history. Trump openly admitted he was taking control of Venezuela’s oil. There are a lot of bad dictators/presidents in the world, but you will only be taken out if you don’t have nukes and you are sitting on top of the world’s largest oil reserve. Trump was promising $2 a gallon gasoline, now that he controlled Venezuela as a vassal state.

The best laid plans don’t always pan out, as oil rose from $57 per barrel on January 3 to $67 per barrel on February 27, the day before Trump launched a shameful decapitation surprise attack on Iran while Bibi’s two Israeli agent envoys (Witkoff, Kushner) pretended to be negotiating a deal, taking out most of their political and military leadership. He actually thought he could pull off another Maduro three day conflict, but stated publicly on March 1 it would last 4 or 5 weeks. I wonder if he ever watched Get Smart in his younger days, because his estimate has proven to be slightly optimistic as we approach month 5 of a conflict showing only signs of growing wider and more deadly.

As we slog through this increasingly chaotic Fourth Turning, I’m always aware of Strauss and Howe’s warning about what could befall the world during this crisis.
“The risk of catastrophe will be very high. The nation could erupt into insurrection or civil violence, crack up geographically, or succumb to authoritarian rule. If there is a war, it is likely to be one of maximum risk and effort – in other words, a total war. Every Fourth Turning has registered an upward ratchet in the technology of destruction, and in mankind’s willingness to use it.” – The Fourth Turning – Strauss & Howe

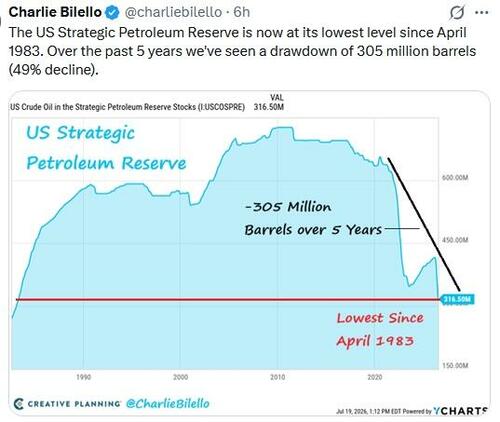
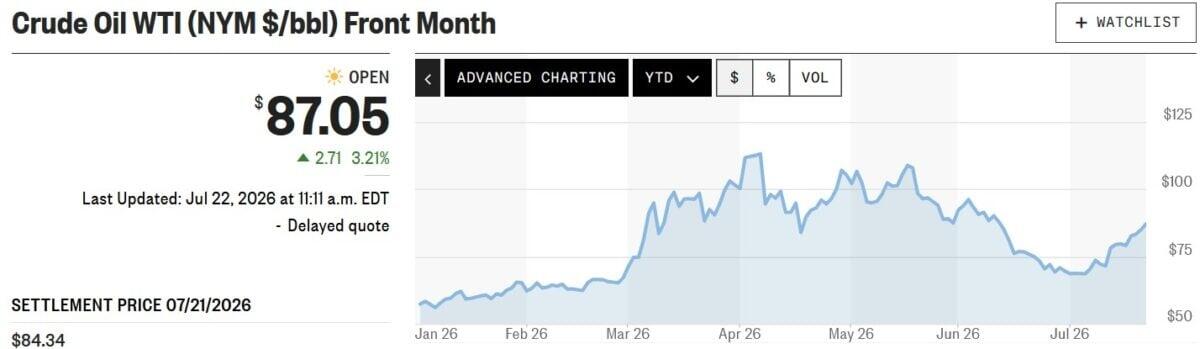
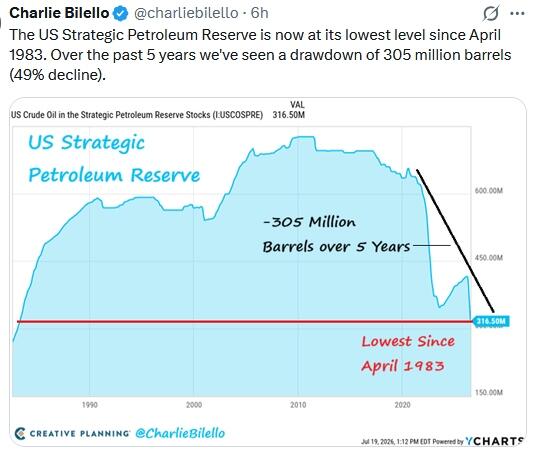
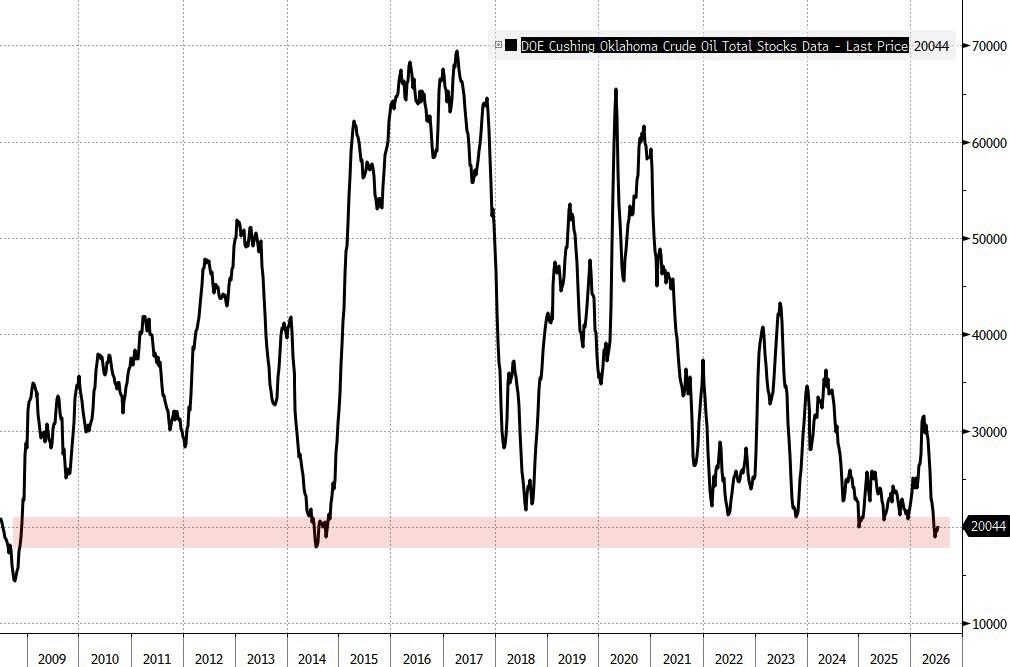
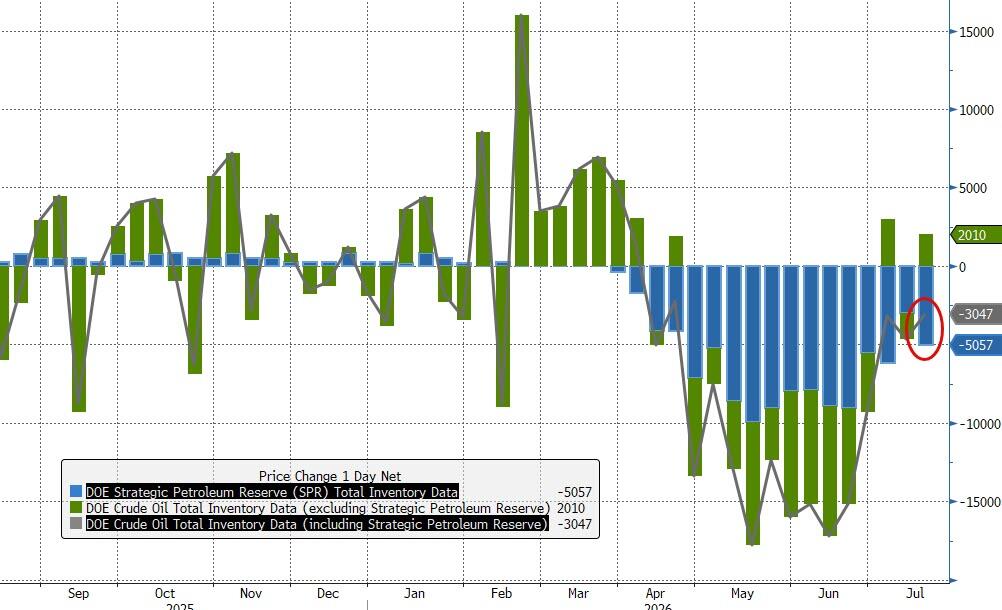
In case you haven’t noticed, Trump’s promise of $2 a gallon gas might be a little optimistic. By mid-April oil reached $119 per barrel, over 100% more than at the start of the year. Here in PA. I paid $2.89 per gallon on the day before Trump’s war of choice on behalf of Israel, and within two months was paying $4.79 per gallon. Through a combination of draining our Strategic Petroleum Reserve to a 43 year low, Scott Bessent and his Wall Street cronies manipulating the derivatives market to suppress the price of oil, Trump making false statements on Truth Social about imminent agreements, and the fake MOU which would never be honored, they were able to maneuver the price of oil back to $68 per barrel, despite the 20% ongoing reduction in global oil flow.
The MOU was never going to be honored by the U.S. The purpose was to buy time to re-arm and move more troops to the Middle East. Smoke, mirrors, and draining our “emergency” reserves in order to preserve the appearance of normality and strength is a pitiful way to run an empire. Trump’s true measure of success is how rich he can make his billionaire cronies by driving the stock market to new heights, no matter the impact on average “non-billionaire” Americans.
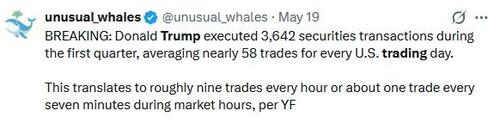
Front running his own Truth Social posts and stock purchases is just icing on the cake for the most corrupt president in U.S. history. He and his family reaped (pillaged?) billions peddling worthless meme coins, while the fleeced MAGA NPCs lost 99% of their “investments”. It was readily apparent Trump insiders were using insider knowledge to bet on polymarket or derivatives market to either go long or short in the oil and stock markets based on his future Truth Social posts, making billions in the process.

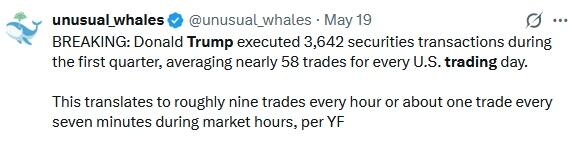
Shockingly, no one has been investigated or arrested. How does Trump find time to do president stuff when he is making 58 stock trades per day? Mussolini was the modern-day representative of merging the state with business to form a fascist ruling structure. Trump makes Benito looks like a minor leaguer, sinking $27 billion of our tax dollars into public corporations, while his sons create companies which are awarded billions in government contracts. Trump has personally invested in at least 20 public companies and then made positive Truth Social posts about them, driving their stock prices higher. This is blatant corruption and stock market manipulation, but the willfully ignorant masses are too distracted by electronic bread and circuses to be bothered. Free market capitalism is dead, but crony corporate fascism is alive and thriving. It’s good to be in the top .01%, or friends and family of Trump.
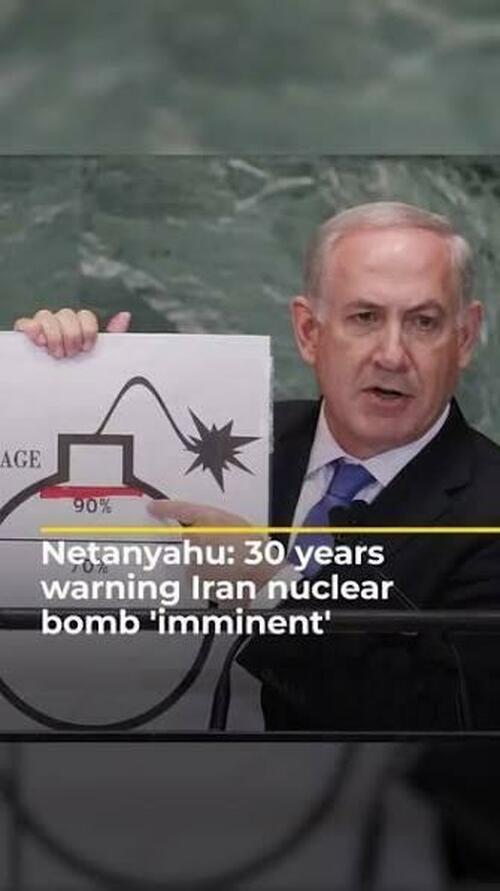
Everyone knows Iran was not close to producing a nuclear bomb, as seventeen government agencies told Trump prior to his surprise attack on Iran, at the behest of Bibi. The bullshit narrative about the Iranian government murdering 30,000, then 40,000, then 100,000, and now 52,000 protestors was also provably false. Trump admitted the protests were enabled by Mossad and the CIA. Netanyahu has been declaring Iran two weeks away from a nuclear bomb for thirty years. If we had really obliterated their secret nuclear sites in June 2025, like Trump and Hegseth declared, how could they again be two weeks away from a nuclear bomb?
Everything about this war on Iran is based on lies, mistruths, and propaganda, as the true motive is to further Netanyahu’s Greater Israel project of taking Gaza, Lebanon, and Syria, while defanging Iran and Turkey. Netanyahu convinced Trump it would be a cakewalk, or more likely, threatened Trump with revelations from the Epstein files. The assassination of Charlie Kirk for beginning to reveal the truth about Israeli control of the U.S. government and genocide in Gaza was also a warning shot across Trump’s bow. Now Bibi is declaring Turkey a threat to Israel’s grand plan. If there is a more despicable human being on the planet than Netanyahu, I can’t think of one.
When you are in a $39 trillion hole and already digging $2 trillion deeper on an annual basis, maybe you shouldn’t start a war costing $1 billion per day, with a current price tag of over $100 billion. That doesn’t even scratch the surface of the long-term impact. Experts at Harvard University warn factoring in munitions replenishment, base repairs across the Middle East, and lifetime veterans’ care could push the long-term price tag well past $1 trillion. In addition, the drastic increase in fuel prices, overall inflation, and interest costs will total approximately $135 billion on an annual basis, or $1,000 per household.
According to Trump, it’s a small price to pay for Israel, since they control our president and congress. While you choose between food, fuel or medicine, trying to survive another month, at least Trump, his family of grifters, his billionaire child raping cronies, the Wall Street cabal, and the AIPAC funded multi-millionaires in congress, are doing just fine.

Despite being a bombastic, narcissistic, egomaniacal self-promoter, I can’t believe he was naïve enough to believe the bullshit about Iran being weeks away from attacking Israel with a nuclear weapon. He had already declared Iran’s nuclear facilities obliterated and promised his MAGA minions no new wars. So, it seems inexplicable for him to willingly start World War III, knowing it would reignite inflation and cause tremendous hardship upon the average Americans who voted for him. Therefore, the only logical conclusion is he started this conflagration unwillingly.
After Attorney General Pam Bondi released an initial batch of files in February 2025 showing Trump on flight logs, Trump began dismissing further file requests as a Democratic “hoax” and began stonewalling further releases. But his nemesis Thomas Massie embarrassed him by pushing through the Epstein Files Transparency Act. The pressure from survivor testimonials and bipartisan congressional coercion forced his hand and he signed the bill.
The partial release of heavily redacted files revealed horrific evidence of rape, torture, pedophilia, child sacrifice, trafficking, bribery, and an ultra-rich Epstein class of deviants running this world. Trump’s minions at the DOJ and FBI have since declared this case closed, with no arrests, no naming of any loathsome pedophiles, and most importantly no further Trump revelations.

Since Epstein, who didn’t kill himself, was a Mossad agent, there is a high likelihood any perverted or criminal behavior on the part of Trump throughout his playboy life is documented and captured on film, in the possession of Netanyahu. Trump has spent 2026 raging, pillaging, bombing, and performing on the world stage as a court jester in Netanyahu’s game of thrones. His actions and words grow more desperate and unhinged by the day.
As a Prophet generation leader, along with Putin, Xi, and Netanyahu, he will continue to be a catalyst for setting in motion events which will lead to much bloodshed, chaos, death, financial collapse, and end of the American empire. A toxic mixture of vanity, pomposity, privilege, anger, advanced age, and narcissistic personality disorder, is a bad combination in a world leader capable of blowing up the world. Desperate people do desperate things, and Trump’s recent pronouncements appear desperate.
The linear thinking dupes, who choose to not understand the cyclical nature of history, were lulled into think the MOU signed by Iran and Trump on June 17 would deescalate the war and lead to peace in our time. That is not how Fourth Turnings are resolved. They intensify until all-out war, with millions of deaths, decides the true winners and losers. There are no compromise solutions during a Fourth Turning.
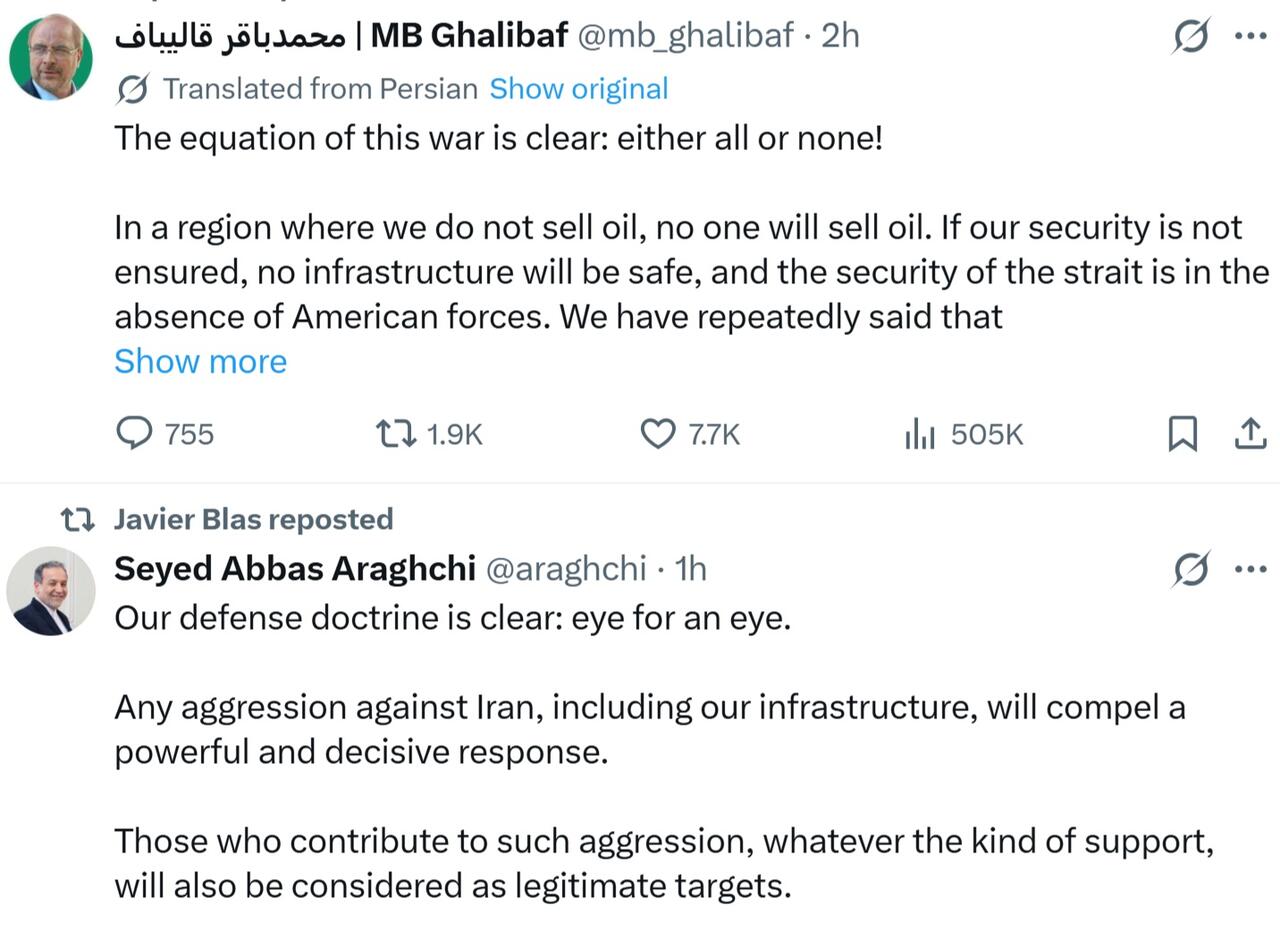
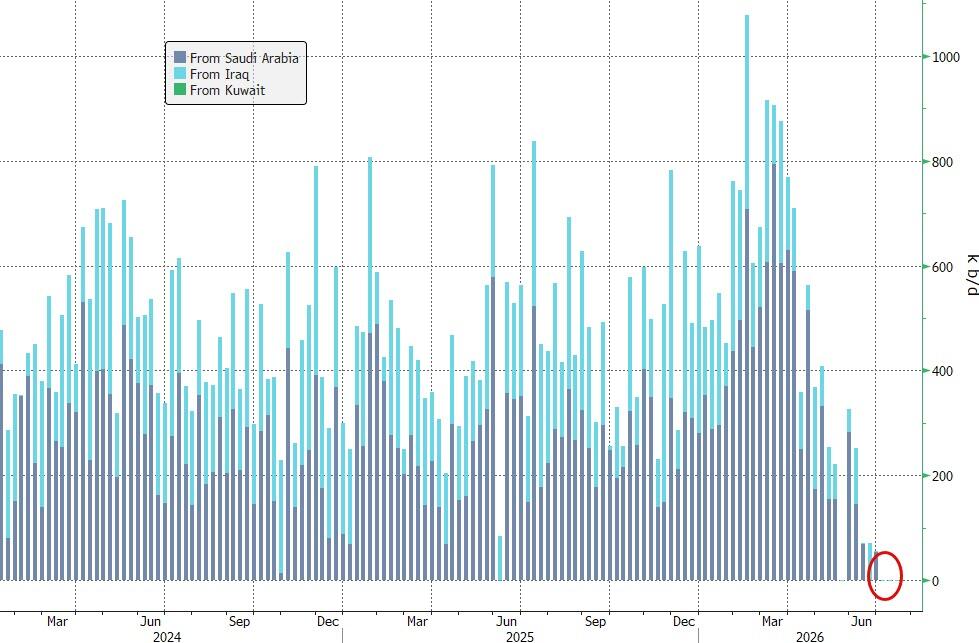
The 14 points in the MOU were essentially the U.S. admitting strategic defeat, which is what has happened. Trump tried to spin it as an American victory, but only his most adoring MAGA NPCs (who probably believed the Q bullshit during his 1st term) believed his lies. The MOU wasn’t worth the paper it was written on, and full-scale war, with the Strait of Hormuz essentially closed, has been raging for the last ten days. Trump has trapped himself in an unwinnable war of attrition, with no accessible escape hatch.

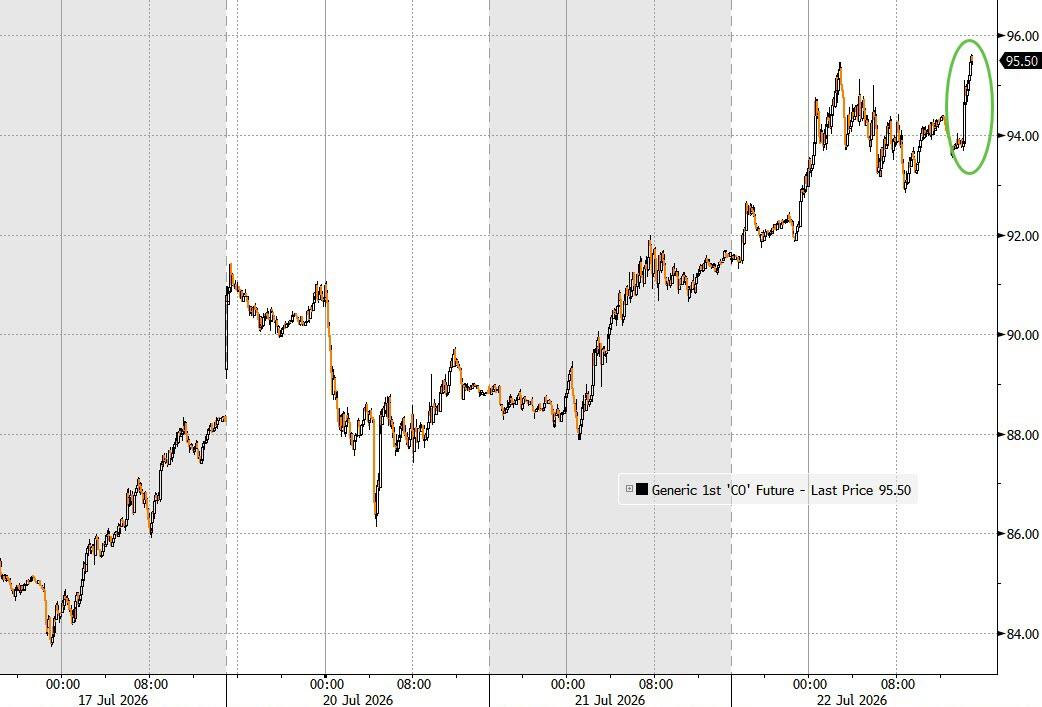
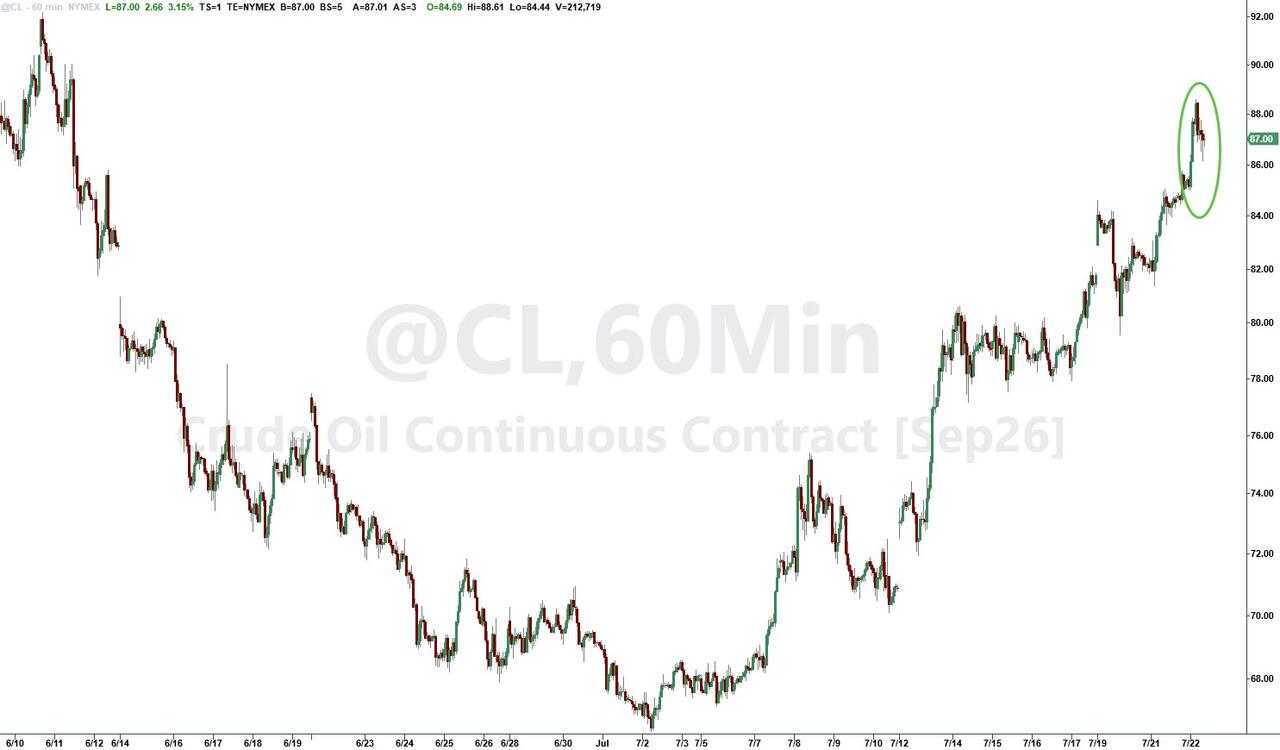
On February 27 the Strait of Hormuz was open, oil was $67 per barrel, all U.S. bases in the Middle East were functional, inflation was trending lower, interest rates were trending lower, the global economy was functioning smoothly, the SPR had 415 million barrels of oil, we hadn’t spent $113 billion we don’t have, and Trump wasn’t Bibi’s bitch, yet.
Today, the Strait of Hormuz is closed, oil is $86 a barrel and heading higher, we’ve drained 110 million barrels of oil from the SPR (lowest level since 1983), every U.S. military base in the Gulf has been damaged or obliterated (tens of billions in damage), inflation hit 4%, the 10 year Treasury at 4.64% is the highest of Trump’s presidency, we continue to spend $1 billion per day on an unwinnable war (with a $1 trillion long-term price tag), the global economy is in shambles, with famine and economic depression now baked into the cake Trump has baked. Iran, with the help of Russia, China, Iraq, Yemen and other allies in the region are accurately targeting U.S. bases and troops, resulting in mass casualties, which Hegseth covers up. Satellite pictures don’t lie, unless the U.S. government coerces satellite companies to not show the truth.

“History offers no guarantees. Obviously, things could go horribly wrong – the possibilities ranging from a nuclear exchange to incurable plagues, from terrorist anarchy to high-tech dictatorship. We should not assume that Providence will always exempt our nation from the irreversible tragedies that have overtaken so many others: not just temporary hardship, but debasement and total ruin. Losing in the next Fourth Turning could mean something incomparably worse. It could mean a lasting defeat from which our national innocence – perhaps even our nation – might never recover.” – The Fourth Turning – Strauss & Howe
I have an uneasy feeling Strauss & Howe’s haunting warning from nearly forty years ago is currently playing out in real time. We are already in the midst of World War III, but the masses are too dumbed down by their government school indoctrination; too distracted by their Igadgets, betting apps, likes & followers on their social media, and going further into debt trying to appear successful; too brainwashed by propaganda; and too apathetic to care, as their country and the world accelerate towards debasement and total ruin.
Propping up this Potemkin empire by sinking $5 billion per day further into debt, while utilizing financial derivatives schemes to elevate the stock market and suppress the oil and gold markets, and initiating an AI surveillance gulag state through the construction of hundreds of surveillance centers and tracking our every movement through their Flock cameras, appears to be a desperate last ditch effort by the Deep State billionaire globalist Agenda 2030 overlords to retain their power, control, and wealth. If it takes World War III and the deaths of billions to achieve their goal, so be it, in their warped world view.
Most people are trapped in their normalcy bias, minimizing the threats steamrolling directly towards them, while delaying the necessary logical steps they should be taking to prepare. I’m reminded of the outbreak of World War II when Germany invaded Poland on September 1, 1939, with Great Britain and France declaring war on Germany two days later. Then virtually nothing happened for the next nine months. The people in London, Paris and Berlin acted as if life would go on normally, with no consequences from the declarations of war. People in the U.S. observed this odd European dispute from a distance, still trying to emerge from their Great Depression.
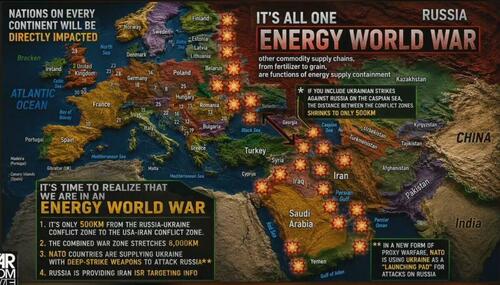
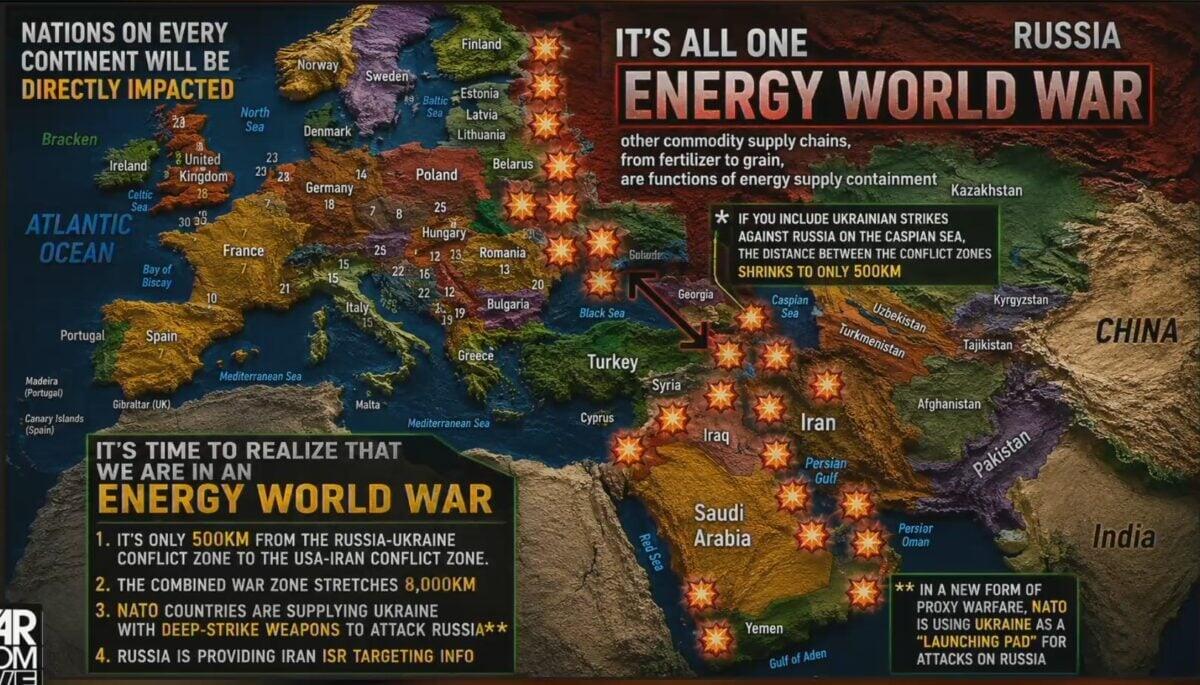
Their normalcy bias was shattered by a blitzkrieg, nightly bombings, Barbarossa, and Pearl Harbor. Over 65 million would die. I believe Matt Bracken’s observations about this being an energy world war, extending from Kiev to Hormuz, with a likelihood of it expanding into Europe, Turkey, and Taiwan, as the three numbskulls running France, Germany, and Britain are willing to go to war against Russia to distract their populace from their decisions to encourage hordes of 3rd world dreck to destroy their countries from within.
The Great Reset Epstein class see World War III as an opportunity, just as they saw the Covid Plandemic as an opportunity to further their new world order plan of depopulation, CBDCs, 15-minute gulags, 24-hour surveillance, and social credit scoring to keep the peasants controlled, subservient, and neutered. Freedom, liberty, and living without restrictions are not in their master plan. Thus far, Putin has acted the most statesmanlike among the Prophet generation world leaders, but with the EU/NATO/Trump increasingly deadly provocations in waging a proxy war on behalf of Zelensky, have pushed him to his limit.
Make no mistake, this proxy war would not be ongoing without U.S. munitions and satellite targeting. Putin is also being pressured by hawks within his country to take more drastic measures against the EU psychopaths in suits trying to destroy Russia. His attacks on Kiev have become more frequent and more deadly. If his NATO enemies push him too far, he may directly attack within the EU, then all hell would break loose.
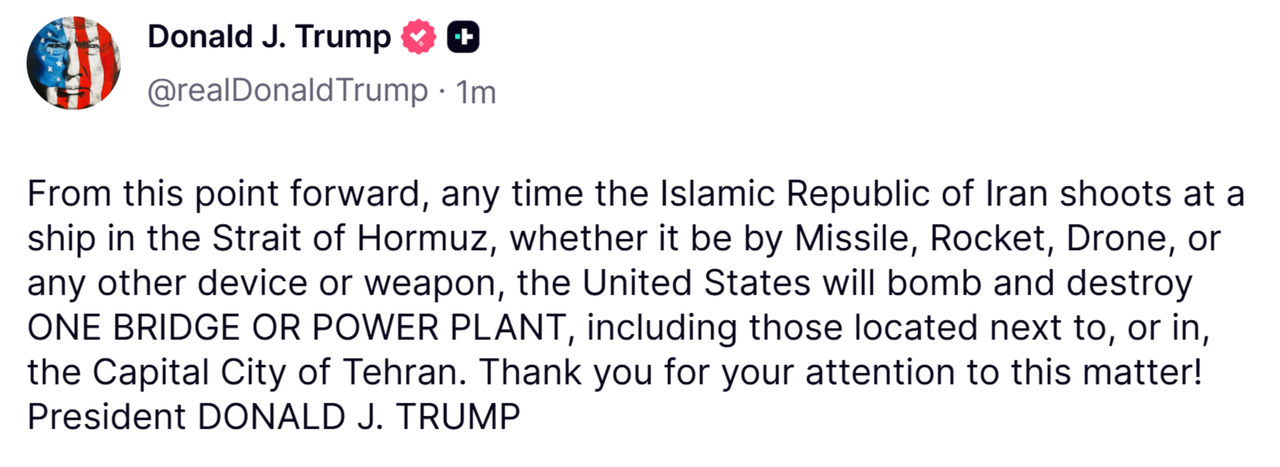
Trump has increased attacks on Iran infrastructure and is being pushed by his lying neo-con Israeli handlers to nuke an underground mountain fortress where Israel claims Iran is reconstituting their nuclear program. More Israeli lies. If a nuke is utilized, then Russia and China may be forced to actively intervene on Iran’s side.
When someone starts acting as desperate and deranged as Trump has been behaving lately, the citizens of this country, and the world, should be fearful and worried what kind of reckless irrational act an 80-year-old vain egomaniac could make to set in motion worldwide destruction. It’s like the world is at the mercy of a crazed monkey trapped in a room full of dynamite, lighting matches. With a true psychopath like Netanyahu pulling his strings, expect an enormous false flag event to trigger the final phase of this Fourth Turning.

We have already entered this Fourth Turning’s global war, and the average American has no clue. As Thomas Paine declared, this is no time for summer soldiers and sunshine patriots. The apathetic, ignorant, dumbed down masses, who have been propagandized into believing their government and sedated with drugs, toxic foodstuff, and electronic baubles, will be violently shaken from their self-induced stupor, once their comfortable lives are shattered by economic, financial, and social collapse of a tyrannical system designed to enrich the few at the expense of the many.
There are evil men ruling this world. These oligarchal billionaire globalist psychopaths treat you like parasites that must be extinguished for their plans to succeed. They appear to be invincible, but they are few and we are many. As darkness descends upon our world, many trials and tribulations await, as there is no voting our way out of this crisis. It will require force of arms.
“The seasons of time offer no guarantees. For modern societies, no less than for all forms of life, transformative change is discontinuous. For what seems an eternity, history goes nowhere – and then it suddenly flings us forward across some vast chaos that defies any mortal effort to plan our way there. The Fourth Turning will try our souls – and the saecular rhythm tells us that much will depend on how we face up to that trial. The saeculum does not reveal whether the story will have a happy ending, but it does tell us how and when our choices will make a difference.” – The Fourth Turning – Strauss & Howe
King George and his empire seemed invincible in 1776 during the first American Fourth Turning, when Paine compared tyranny to hell. The remainder of this Fourth Turning will try our souls, but our fortitude and courage will matter, along with the choices we make. Conquering tyranny will be bloody and require good men to do bad things, but will make our triumph glorious, on par with Washington’s victory over the British empire. Prepare for the worst and hope for the best.
Views expressed in this article are opinions of the author and do not necessarily reflect the views of ZeroHedge.
Tyler Durden
Wed, 07/22/2026 - 16:20


 Cyclospora cayetanensis oocysts in a stool sample, in an undated file image. CDC via The Epoch Times


 IRIB via AFP/Getty Images
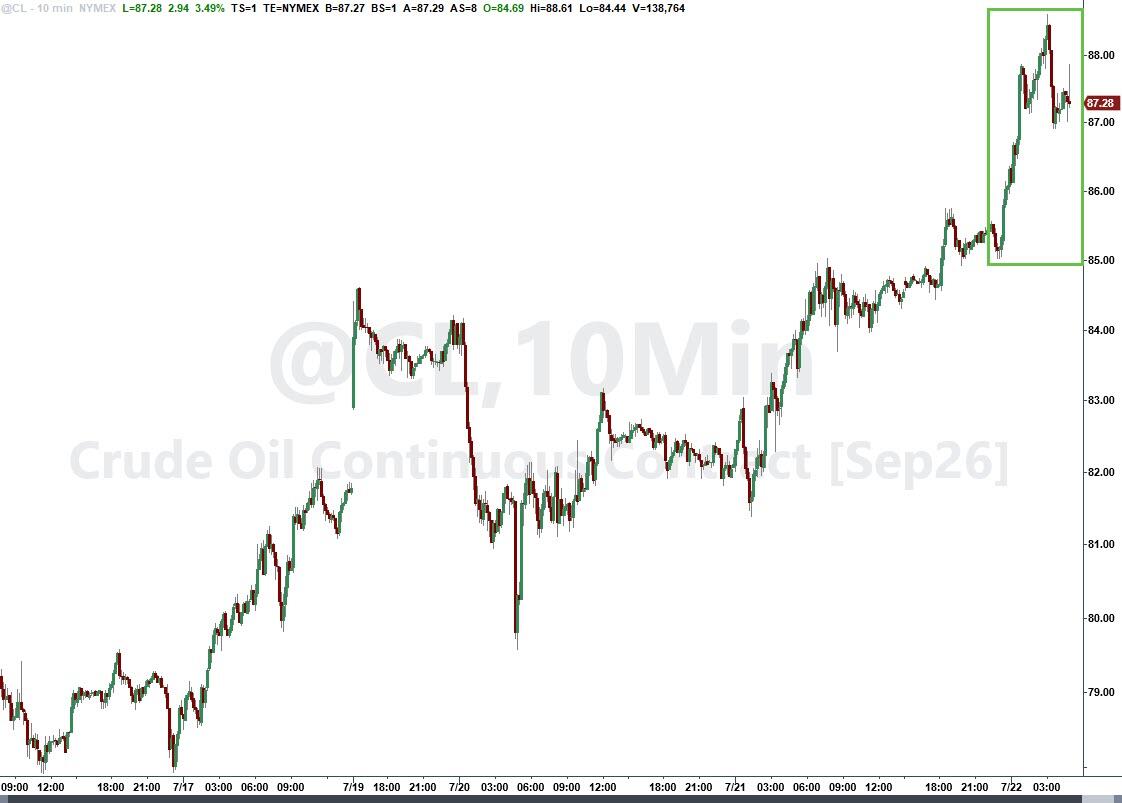


 Independent Journalist Nick Shirley speaks at Freedomfest in Las Vegas, on July 9, 2026. (John Fredricks/The Epoch Times
 Children watch television at ABC Learning Center in Minneapolis, Minn., on Dec. 31, 2025. Mark Vancleave /AP Photo


 Getty Images


 Bezalel Smotrich leads the Religious Zionism party and wants Israel to annex the West Bank and Gaza (MENAHEM KAHANA / AFP)
 Army SGT Michael Swinton was killed July 19 when a controlled detonation of an Iranian drone went terribly wrong (Mia Gonzalez-Swinton via
  1LT Tyler Feehan and PVT Isabella Gonzales were two of three Army soldiers killed in the Iranian strike on US forces at base in Jordan

 Supreme Court Associate Justice Clarence Thomas poses for an official portrait at the East Conference Room of the Supreme Court building in Washington on Oct. 7, 2022. Alex Wong/Getty Images

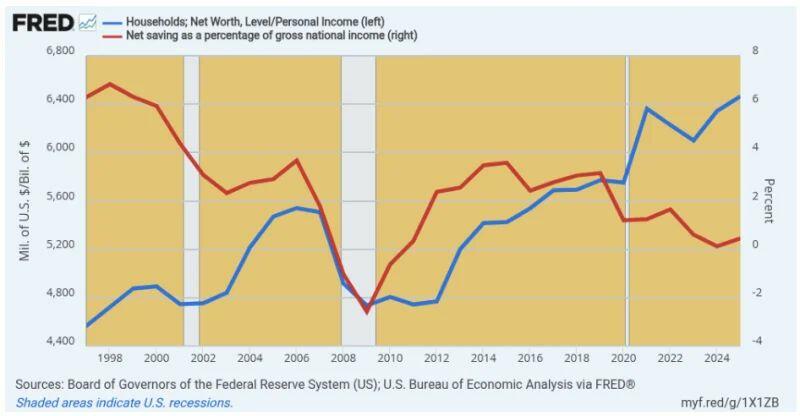 Household Net Worth % Of Personal Income Versus Net National Savings Rate, 1997 to 2025
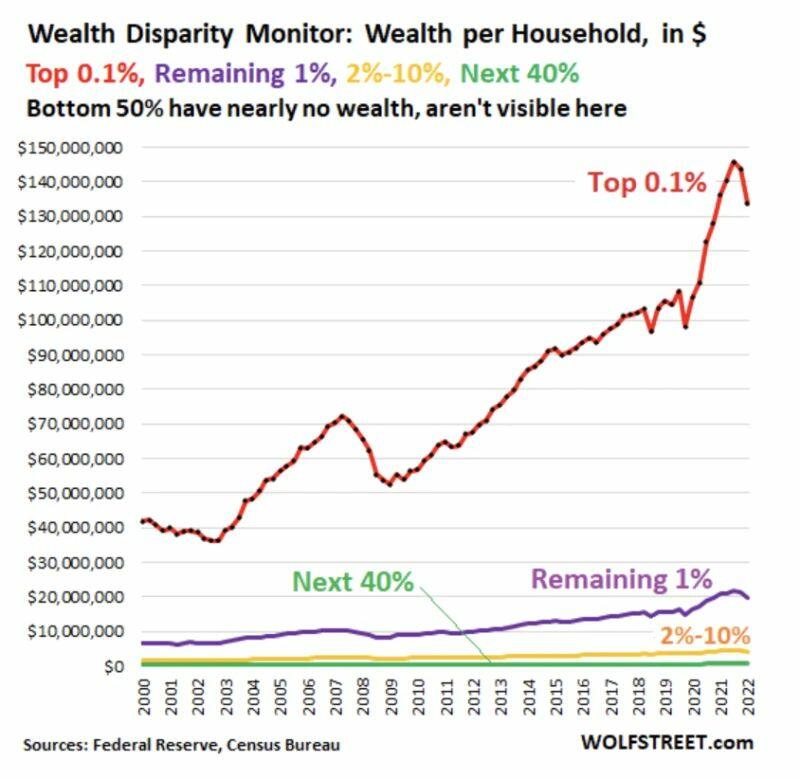
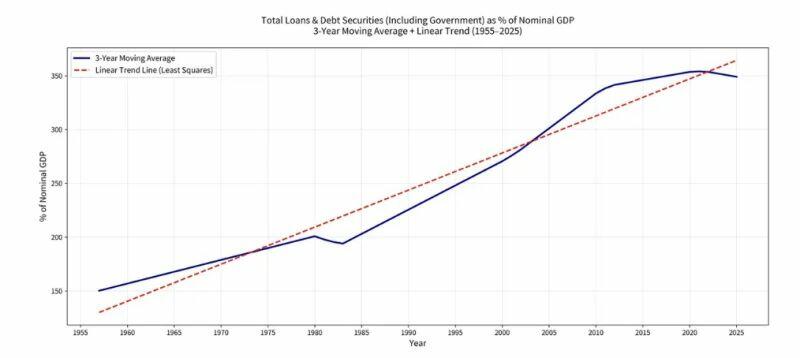
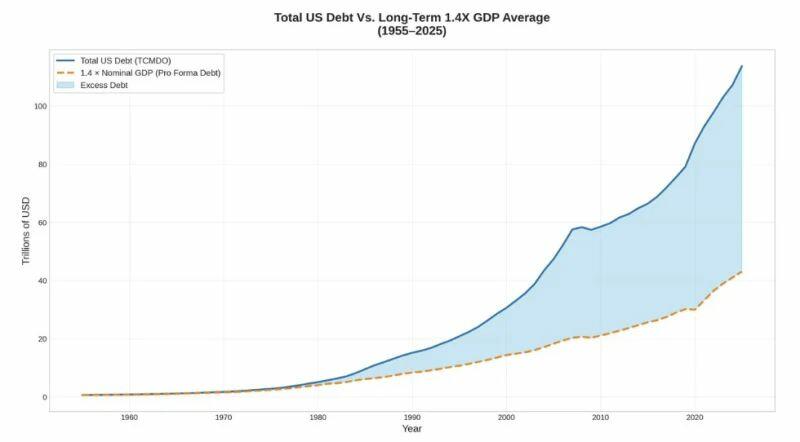
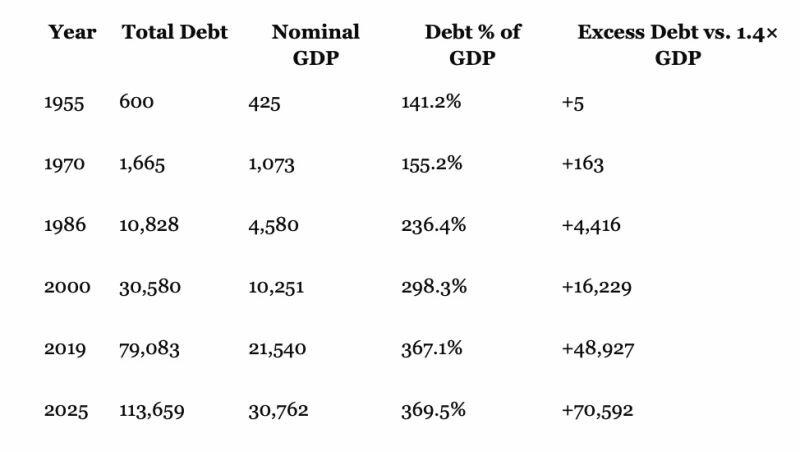 Total Public And Private Debt, Nominal GDP And “Excess Debt”, 1955-2025
Recent comments