
Rude Awakening For AI Hedge Fund Situational Awareness
 Hugh Son of CNBC reports on how Leopold Aschenbrenner built a $45 billion AI hedge fund — and lost most of it in days:
Two years ago, Leopold Aschenbrenner argued he was one of few people in the world who saw the future clearly.
In a sprawling, 165-page essay that became required reading in Silicon Valley, the former OpenAI researcher positioned himself as a kind of prophet for the coming age of artificial super intelligence.
But this week, the limits of Aschenbrenner’s vision were on display when the AI-themed hedge fund he runs — named Situational Awareness, also the title of his viral June 2024 manifesto — ran into the harsh reality of tumbling semiconductor stocks and Wall Street margin calls.
At its peak earlier this month, his fund sat atop $45 billion in assets. By Thursday, however, after being forced to offload all of his leveraged stock bets — including hard-hit names like SK Hynix and CoreWeave — to Ken Griffin’s Citadel at a discount, the fund’s holdings plunged to around $10 billion, according to people with knowledge of the situation.
The story of Aschenbrenner’s meteoric rise and sudden fall has captivated both Wall Street and tech circles, making him the most high-profile casualty yet of the volatility accompanying the AI boom.
A polarizing figure, his online followers saw Aschenbrenner — a Columbia University valedictorian at age 19 — as a genius of the next big thing and followed his fund’s quarterly filings for clues on hot AI stocks.
Before this month’s decline, Situational Awareness racked up gains of more than 1,000% since inception, The Wall Street Journal reported last month. The Journal noted Aschenbrenner was just 24 years old.
Meanwhile, critics pointed out that Aschenbrenner had no experience running money prior to launching his fund in July 2024, calling him more lucky than smart. Some noted that his early work experience was at the doomed crypto firm FTX, where he helped now-disgraced founder Sam Bankman-Fried run a charity out of a Bahamas penthouse.
Others on Wall Street, including former traders at global investment banks, noted that in light of reports Situational Awareness used as much as 400% leverage, the collapse wasn’t shocking.
“A lot of people saw this blow-up as a matter of not if, but when,” said Jerry Diao, who runs a Wall Street coaching firm. “Maybe his views on AI are correct in the long run, but in the public markets, you have to be prepared for the short-term.”
The hedge fund didn’t immediately respond to a request for comment from CNBC.
Earlier this week, before the sale to Citadel, about two-thirds of Situational Awareness holdings were in long and short positions in public equities, according to one source. The rest were stakes in private companies, dominated by a multibillion-dollar Anthropic investment, the person said.
CNBC’s sources spoke on the condition of anonymity to discuss nonpublic details.
The near-collapse of Situational Awareness coincides with the hedge fund manager’s wedding, set for this weekend, sources told CNBC’s David Faber. Aschenbrenner is engaged to Avital Balwit, chief of staff for Anthropic CEO Dario Amodei, according to a Fortune profile.
‘Weirdness’ and ‘disagreeableness’Born in Germany to physician parents before moving to the U.S., Aschenbrenner showed an early aptitude for math and computer science, according to profiles and podcast interviews.
He skipped several grades in the German school system, graduating high school at age 15, and as a teen at Columbia University he garnered attention for an academic paper titled, “Existential Risk and Growth.”
A Columbia classmate, Sofia Montrone, said that she hadn’t heard of Aschenbrenner before meeting him over Zoom shortly before their 2021 graduation.
“It was not like he was some prince, emerging out of the school,” Montrone told CNBC. “He was just some guy.”
In the interaction, Montrone, who was salutatorian, said she found her classmate “child-like” and socially awkward.
Aschenbrenner has since said that his personality — what he called his own intellectual “weirdness” and “disagreeableness” — was punished in German culture. He came to see it as the source of his edge.
While at Columbia, he co-founded the school’s chapter of Effective Altruism, a philosophy popular in some tech circles that advocates for founders to make the most money possible in order to help humanity.
That network became his career pipeline, eventually leading him to work with another effective altruism proponent — Bankman-Fried — after his graduation in 2021. He worked for a stint at the Future Fund, the philanthropic arm of FTX, before the crypto firm’s collapse.
In 2023, Aschenbrenner landed on OpenAI’s Superalignment team, working under Ilya Sutskever on the problem of keeping AI aligned with human interests. After a hacker breached OpenAI’s internal systems, he wrote a memo to the board warning that the company’s security wasn’t strong enough to stop foreign espionage, naming China specifically.
In 2024, the company fired Aschenbrenner after accusing him of improperly sharing confidential information, a characterization he has disputed, saying he was raising concerns about the company’s security practices.
“I liked Leopold while at OpenAI,” Scott Aaronson, a computer scientist now at the University of Texas at Austin who previously worked on AI safety at OpenAI, told CNBC this week in an email.
“I was sorry when he got pushed out because of sharing information in a way leadership didn’t approve of,” he said. It “sounded like he was trying to do the right thing and they overreacted.”
An OpenAI spokesman declined to comment and referred to statements the company made at the time that the firm disagreed with many of Aschenbrenner’s claims.
Representatives for Columbia University and its Effective Altruism chapter didn’t respond to requests for comment.
Stripe, Github investorsWeeks after his departure from OpenAI, Aschenbrenner turned his brief experience at the leading AI firm into a sweeping vision of where artificial intelligence, and the world, was headed.
His June 2024 essay argued that artificial general intelligence could arrive within years and that governments were badly underestimating the pace of progress. Admirers saw it as evidence that Aschenbrenner was a prodigy with valuable insight into AI’s trajectory, while critics said it overstated both the technology’s near-term capabilities and his own certainty about the future.
By July of that year, Aschenbrenner parlayed his rising fame into seed capital for his hedge fund, raising a reported $225 million from Stripe co-founders Patrick and John Collison, former GitHub CEO Nat Friedman and investor Daniel Gross.
That would mark the start of a two-year run unlike any in recent Wall Street history.
“Before long, the world will wake up,” Aschenbrenner wrote at the time, adding that only a few hundred people in the AI community knew what was coming.
“If they are seeing the future even close to correctly,” he wrote, “we are in for a wild ride.”
Yun Li of CNBC also reports on why Situational Awareness hedge fund imploded, even in a tame stock market:
The stock market looked unusually tranquil. Beneath the surface, one of Wall Street’s fastest-growing funds devoted to artificial intelligence investments was unraveling.
In a matter of weeks, Leopold Aschenbrenner’s Situational Awareness went from managing roughly $45 billion to being forced into a sweeping reduction of its listed-stock positions as a historic momentum reversal triggered losses on both sides of its portfolio and set off margin calls and compulsory sales.
Situational Awareness had built concentrated positions in one of Wall Street’s most popular trades: owning companies expected to supply the chips, data centers, power and other infrastructure behind the AI boom while betting against software firms viewed as vulnerable to the technology’s disruption.
Its long positions were concentrated among some of the market’s biggest AI beneficiaries. Public filings showed large stakes in Nebius, Bloom Energy, Sandisk, CoreWeave, SharonAI and IREN as of March 31. By Wednesday’s close, those shares had fallen between by 50% and 78% from recent peaks.
At the same time, software stocks like Adobe that had been used as the short leg of the trade rallied. That meant the fund wasn’t protected by its hedges. Instead, the longs and shorts lost money simultaneously.
“People get over leveraged in this market, and they get seduced by the big returns that some of these companies can deliver,” said Bob Lang, founder and chief strategist at Explosive Options. “If you’re not managing your risk properly, this is the sort of thing that’s going to happen to you.”
As the value of the portfolio fell, the fund’s equity cushion shrank and its prime brokers demanded additional collateral. Raising cash required selling more holdings, adding further pressure to sliding stocks and generating additional losses. What might otherwise have been a painful drawdown became a deleveraging spiral. Ken Griffin’s Citadel hedge fund reached a deal to buy the fund’s publicly traded assets.
“Running somebody out the door like this is as old as time,” Lang said. “I’ve seen it happen a lot in oil markets ... there’s a lot of things that are happening underneath the surface that we really don’t know about.”
Momentum crashThe episode offers a stark example of how a hedge fund can sustain devastating losses even when major stock indexes appear relatively calm. The S&P 500 remained near record levels as the damage unfolded, masking one of the most violent reversals in market leadership in decades.
“There is no other way to put it, we just witnessed the largest/ fastest momentum crash in modern history,” Jonathan Krinsky, chief market technician at BTIG, said in a note. “And it wasn’t particularly close.”
Morgan Stanley’s sector-neutral Momentum Index tumbled 17.4% in just four trading days, its worst such decline on record, according to BTIG. The drop surpassed the momentum reversals that followed the dot-com bust, the pandemic shock and the 2022 inflation-driven bear market.
The iShares MSCI USA Momentum Factor ETF posted its best month ever as recently as April, and is now on pace for its worst month, illustrating how quickly one of the year’s strongest strategies turned into one of its weakest.
Clearing event?AI infrastructure stocks rebounded sharply Thursday as investors increasingly interpreted the previous several weeks of volatility as the product of a technical dislocation rather than a deterioration in the industry’s fundamentals.
With one of the market’s largest forced sellers stepping back, traders rushed into many of the same chipmakers, power companies and data-center plays that had been at the center of the selloff. The tech-heavy Nasdaq Composite jumped for a second day Friday, on track for a weekly gain of 0.9% after suffering steep losses the last two weeks.
Still, not everyone believes the forced unwind marks the end of the AI selloff.
Among the most prominent skeptics is Michael Burry of “The Big Short” fame. Burry has been one of Wall Street’s most vocal critics of the AI boom, arguing that much of the industry’s demand is being sustained by financing arrangements rather than end customers.
Rather than viewing Thursday’s rebound as a turning point, Burry used the rally to add to bearish positions in Micron, the VanEck Semiconductor ETF and Nvidia put options, according to a Thursday Substack post.
“The knee jerk reaction to the Paired Momentum unwind yesterday has been to put it back on today,” Burry wrote. “This was a historic reversal, even more so than what happened 26 years ago,” when the dot-com bubble began to burst in 2000.
Burry said oversold and overbought conditions made a short-term bounce unsurprising, but he questioned whether the trade still had staying power.
“The legs,” Burry wrote, already “they look tired.”

What an insane week full of market action!!
Let me blunt: This week is the type of volatile week elite hedge fund traders dream about.
You had Big Tech earnings, a big Fed meeting, a big Bank of Japan meeting and currency intervention, and a major hedge fund focused on AI imploding because it was way over-leveraged in AI growth stocks.
What more can elite hedge fund traders ask for?
From the big names, Alphabet, Amazon and Microsoft added nearly $1.5 trillion in combined value this week:
Wall Street is growing increasingly divided over AI’s winners and losers after the world’s largest technology companies reported earnings and affirmed or raised their capex forecasts, suggesting the spending spree isn’t letting up yet.
Nearly $2 trillion has moved this week into or out of the six megacaps that have reported earnings this season so far. The three biggest hyperscalers, Amazon, Microsoft and Alphabet, have all seen their market caps surge after posting strong cloud growth. It suggests that investors believe returns may be in sight after the companies committed to spend billions on AI.
Microsoft gained over $600 billion in market cap this week, while Amazon and Alphabet both added more than $400 billion.
On the other end, Meta has seen its stock plunge after earnings, as investors weren’t sold on its AI investment strategy, erasing about $85 billion from its market cap this week. Apple suffered a steeper drop, losing more than $350 billion in market value, as the memory shortage weighed on its outlook. Tesla lost about $7 billion in market value after it went cash flow negative and forecast higher spending.
AI spending among the megacaps is “trending” toward almost $800 billion over the next 12 months, Jason Greenberg, co-head of global tech, media and telecom investment banking at Jefferies, told CNBC’s “Squawk on the Street” on Friday.
Investors no longer question whether people are adopting AI, or if there’s real demand for chips and compute capacity, Greenberg said.
“It’s whether in the long term demand is going to be sufficiently profitable to warrant all of this investment,” Greenberg said. “I think overall that’s the real issue that we’re struggling with right now.”
Investors are in "show-me-the-money" mode, and companies that understand this (Microsoft, Amazon) got rewarded while those who don't (Meta) got punished.
As far as the Fed, Chairman Wash spoke out of both sides of his mouth this week to justify staying put on rates despite internal dissent at the Fed.
Maybe he knew of a major hedge fund imploding and decided this wasn't a good week to raise rates, but the longer the Fed puts off hiking rates, the bigger the risk they will hike more aggressively in the future.
As far as market action, let me show you the 5-day chart of two of Leopold Aschenbrenner's major holdings -- Sandisk and CoreWeave:


Both of them were down on Fed day (Wednesday) and then surged Thursday and Friday morning before closing red today.
Elite hedge funds -- not just Citadel, which bought Aschenbrenner's book at a discount -- knew there was blood on the Street, they were all aware of Situational Awareness's margin calls, and they pounced at the right moment to trade these stocks.
In fact, I can tell you that shares of Sandisk were down 8% on Wednesday around noon, two hours before the Fed's decision, then were up 7% at 3 p.m. before closing down 7% that day. Then they surged over 30% Thursday and Friday morning before closing down 5% today.
It looks like short covering took place in both stocks, so I agree with Dr. Michael Burry, too soon to declare the downtrend is over.
So, pay attention to Aschenbrenner’s positions, all 34 of them available here.
That's where the market action is these days but more broadly, pay attention to momentum, because there too, it just looks like short covering this past week, with the downtrend intact:

I can say the same about tech shares in general, despite this week's pop (short covering?), they remain in a downtrend:

Anyways, insane week, full of action!
Leopold Aschenbrenner's hedge fund blew up and that's not a shocker; his fund was levered four times in AI growth stocks. It's fun when they're going parabolic, but painful when momentum shifts the other way.
I've personally seen so many of these whiz kids blow up in Hedge Fund Land, and stupid investors give them money without realizing they have no money management experience or concept of risk management.
There's a reason why I recommend all investors who invest in hedge funds read When Genius Failed, it documents how smart people do stupid things with leverage, and they all eventually succumb to Mr.Market.
Lastly, when the week began, Leopold Aschenbrenner was preparing for his wedding. The plan was for a multiday celebration in Carmel, a seaside town in Northern California, with the ceremony at a Tuscan-style villa.
By the end of the week, his hedge fund had imploded and Ken Griffin's Citadel was there to pick up the scraps.Griffin has built a successful business profiting off the misfortunes of others.
A good reminder of who makes the real money in Hedge Fund Land.
Alright, that's a wrap. It's Friday and I don't think people realize everything that went on in markets this week.
Here are the top-performing large-cap US stocks this week (full list here):

And the worst-performing US large-cap stocks this week (full list here):

Below, Bloomberg's Hema Parmar details the massive selloff of AI assets from Situational Awareness, one of the world's biggest hedge funds and how Citadel's Ken Griffin stepped in to buy the investments. Parmar said that this move is part of Griffin's 'playbook' and he will often jump in to get a good deal when firms are in distress.
Also, Karl Schamotta, chief market strategist at Corpay, joins BNN Bloomberg to discuss the markets and the outlook for the loonie.
Lastly, DoubleLine CEO-CIO Jeffrey Gundlach joins CNBC’s Scott Wapner following Federal Reserve Chairman Kevin Warsh’s second FOMC press conference. Gundlach’s read is that the market didn’t buy what Chairman Warsh was selling.
While the Fed held rates steady, Gundlach points to the US Treasury yield curve’s sharp steepening during the press conference as the real story, undoing much of the flattening the market had rewarded Chairman Warsh with back in June.
His view is straightforward: If Chairman Warsh is truly committed to getting inflation to 2%, and not a “whisper above,” then holding rates steady while war-driven commodity prices keep climbing is inconsistent with that goal. Gundlach argues the bond market is essentially calling that bluff and now expects the Fed to hike in September to claw back some of the credibility it just gave up.


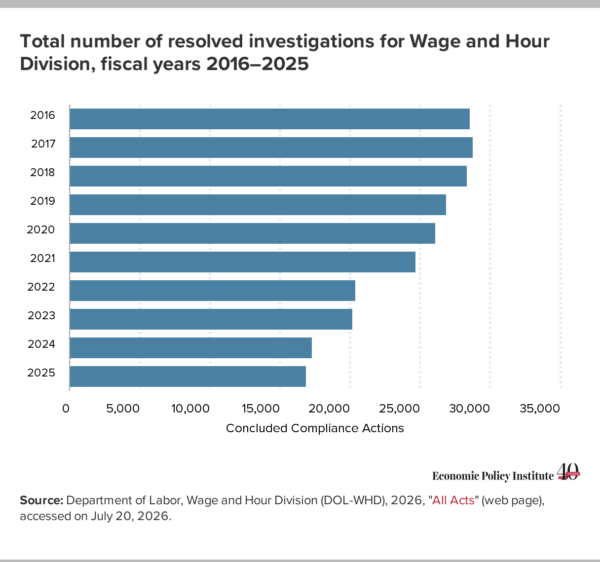
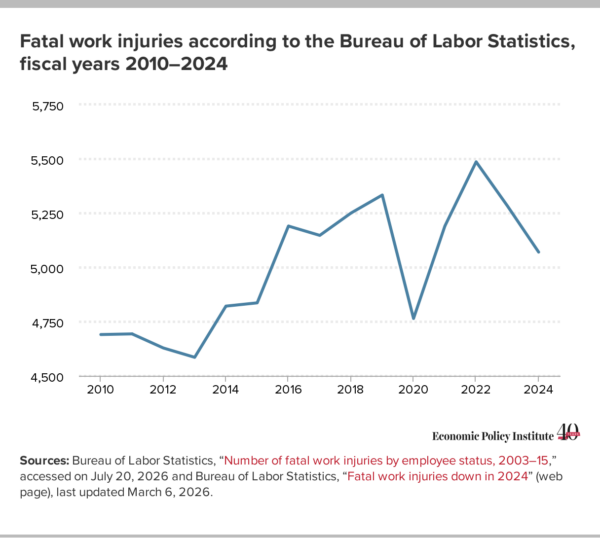
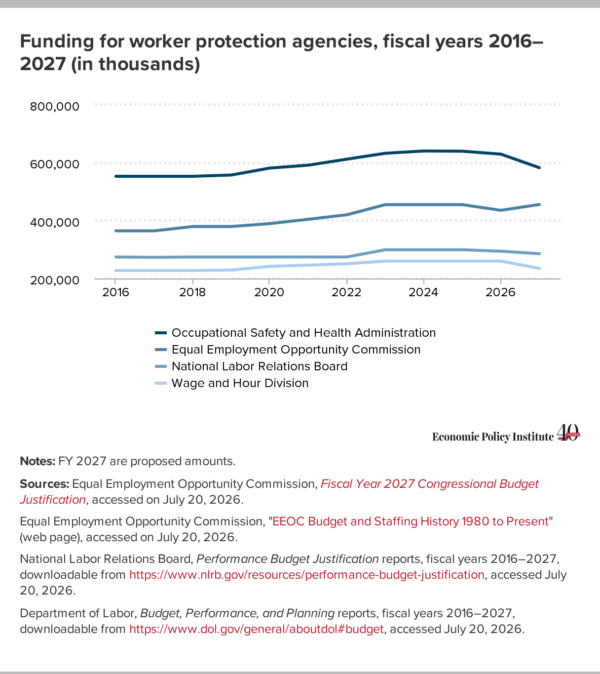 The consequences of underfunding worker protection agencies


Recent comments