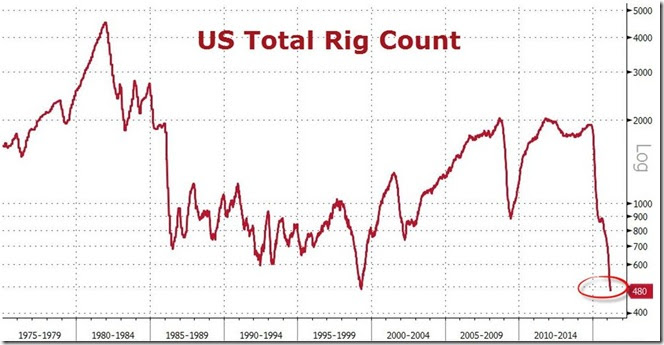
Never before in the history of the US oil and gas industry was there so little drilling going on as there was in the week just ended. The graph above, from an article on this week's rig count at Zero Hedge, shows the total count of rotary drilling rigs running in the US over the past 41 years of Baker Hughes' Excel formatted records, showing that, over that span, we hit a new record low for drilling this week. My own scan of the static Baker Hughes typewritten records revealed the that rig count was at least twice today's count in the previous recorded decade going back to 1968, which closed the year with an average of 1569 rigs active in the US, and the highly respected Oil & Gas Journal says this may be the lowest rig count since the infancy of US oil and gas industry in the mid-19th century, ie, back to "the early part of the Pennsylvania oil boom" in the 1860s...
This has been a long time coming. We've been tracking the Baker Hughes rig count since late 2014 as the best available metric on how much drilling, and how much hence visible environmental damage, was being done by the oil and gas industry, as expensive and disruptive fracking extraction techniques were slowly being pressured by low prices brought on by easy to extract crude supplies from the OPEC countries. 9 of the rigs that had been running during the prior week were shut down this past week, leaving 480 rigs still working. That number eclipsed the previous record low rig count of 488 that had been set on Apr. 23, 1999, and was down by three-fourths from the recent high of 1920 rigs that were drilling on Dec. 5th, 2014, a week after the OPEC meeting that opened the spigots and crashed the oil markets. The all time record high U.S. rig count was set on December 28, 1981 at 4,530, when all the drilling being done was with conventional vertical rigs, which you can also see on the chart above. 6 of the rigs pulled out this week had been drilling for oil, leaving 386 oil rigs still working, while a net of 3 rigs which had been targeting natural gas were also pulled out, leaving just 94 gas rigs still active. Those numbers were down from the 866 oil rigs and 257 gas drilling rigs that were deployed on March 13th of last year, and well off the records of 1609 working oil rigs set on October 10, 2014 and the recent gas rig record of 1,606 that was set on August 29th, 2008...
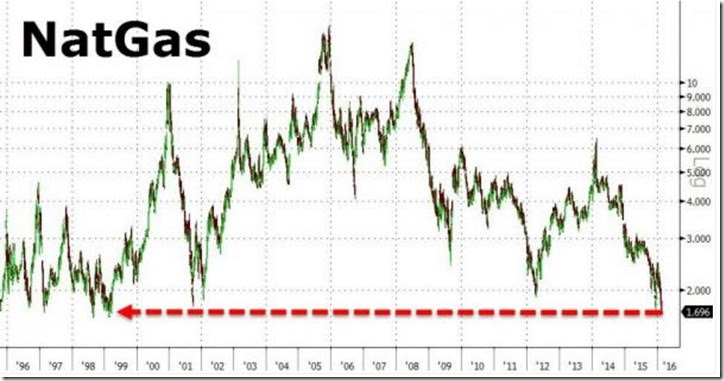
Obviously, oil & gas prices that have remained well below what companies needed to break even in most areas of the US have been responsible for this pullback in drilling. In the graph above, we can see two distinct recent periods where the count of drilling rigs active in the US exceeded 2000; the first, in the span between 2006 and 2008, was driven by excessively high prices for natural gas. Our long term natural gas price chart below indicates that natural gas prices spiked to over $14 per mmBTU in late 2005, and stayed above $6 per mmBTU throughout the next few years, to spike again over $13 in 2008. Most of that period saw more than 1400 active rigs drilling for natural gas each week, and the count of working natural gas rigs subsequently peaked at 1606 rigs on August 28 2008 and again on September 12th of that year. The excess supply of gas brought on by that drilling drove the price of natural gas to below $3 mmBTU by early 2009, and as a result of those low prices, many drillers quit and the gas rig count fell to 665 by midsummer of that year. A return to natural gas prices over $5 brought on the fracking boom of 2010, and then oversupply once again drove natural gas prices below $2 during the mild winter of early 2012, which subsequently knocked the gas drilling rig count back to as low as 413 later that year. With natural gas prices seldom above $4 since, drilling for gas has slowed gradually since, and fell from 162 rigs at the end of 2015 as natural gas prices hit new lows almost every week this year. It should be instructive that the natural gas rig count was over 1600 eight year ago, just as the oil rig count was over 1600 in 2014, and that the natural gas rig count done nothing but gone down since..
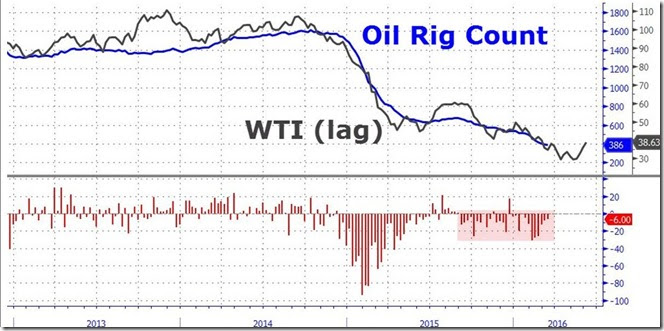
Deployment of rigs drilling for oil has responded to the price of oil in a similar manner. The chart below, from the same Zero Hedge article cited previously, shows the recent oil rig count in blue superimposed over a chart of what the price of the US benchmark WTI oil was 3 months earlier; the correlation between the price of oil and the number of oil rigs deployed 3 months later is pretty obvious. In the hard to read metrics on the side of the graph, it shows that the then current price of oil was at $38.63 a barrel up, more than 40% from the lows hit in January. Oil prices closed last week at $38.50 a barrel, up more than 7% from last weeks closing price of $35.92. A number of drillers who have left wells uncompleted recently have already said they'd be back to complete those wells if oil hits $40 a barrel again...
Details on this week's US rig count
As we noted earlier, this week's total rig count was down 9 rigs to 480, with rigs drilling for oil down 6 to 386, and rigs drilling for natural gas down 3 to 94. Of those net totals, Baker Hughes also reported that two platforms in the Gulf of Mexico were set up and started drilling during the week ending March 11th, so the Gulf rig count is now back up to 26, which is still down from 46 working in the Gulf and down from a total of 48 drilling offshore as of March 13th a year ago. There was also a rig set up on an inland lake in Louisiana, so there are now 3 rigs drilling through inland waters, all in Louisiana, down from the 8 that were set up on inland waters a year earlier. A net of 14 horizontal drilling rigs were stacked this week, cutting the count of active horizontal rigs down to 375, which was also down from the 849 horizontal rigs that were in use the same week last year, and down from the recent record of 1372 horizontal frackers that were drilling on November 21st of 2014. In addition, 3 vertical rigs were also taken out of service, leaving 55, down from the 166 vertical rigs that were drilling last year at this time. However, 8 directional rigs were redeployed, bringing the directional rig count back up to 50, which was still down from the 110 directional rigs that were in use at the end of the same week a year ago...
Of the major shale basins, the large Permian basin of west Texas and eastern New Mexico once again saw the largest decrease, as they were down 6 rigs to 152 rigs as of March 11th, which was down from the 311 rigs deployed in the region a year earlier. In addition, the Eagle Ford of southern Texas was down 3 rigs to 43 this week, which was down from the 146 rigs that were working the Eagle Ford a year earlier, and the Granite Wash of the Oklahoma-Texas panhandle region was down 2 rigs to 8 this week, and down from 26 rigs in the basin a year ago. Single rigs were also pulled out of the Utica shale of Ohio and the Williston basin of western North Dakota, which left 11 in the Utica, down from 33 a year ago, and left 32 in the Williston, down from 104 a year ago. Meanwhile, an additional rig was added in the Mississippian of southwest Kansas, bringing the count there up to 8, down from 42 a year earlier, while 3 rigs were added in the Marcellus shale of the northern Appalachians, which is now back up to 31, but still down from the 63 rigs that were working there last March 13th...
Not surprisingly, the state count tables showed that Texas saw the largest decrease in active rigs, as they were down 12 rigs to 215, which was down from the 512 rigs working the state the same time last year. Oklahoma also got rid of 3 rigs, leaving 67, down from 134 active rigs a year earlier. Corresponding with the basin losses, single rigs were also pulled out of Ohio and North Dakota, leaving Ohio with 11 rigs still drilling, down from 31 rigs a year earlier, and leaving North Dakota with 32 rigs, down from 101 rigs a year earlier. A rig was also pulled out of Kentucky, which now has just 1 rig remaining, down from 2 rigs a year ago. On the other hand, both Pennsylvania and Louisiana saw 3 rigs added this week; that brought Pennsylvania back up to 19 rigs, still down from the year ago count of 47, and brought Louisiana, where the Gulf rigs were allocated, back up to 49 rigs, still down from 93 rigs a year earlier. Two rigs were also added in Kansas, where they now have 9 drilling, down from 14 a year earlier, and single rigs were added in California, Mississippi and Utah. That left California with 7 rigs, down from 14 a year ago, left Mississippi with 2 rigs, down from 4 rigs a year ago, and made for the only active rig still working in Utah, which had 8 working the state last year at this time...
International Rig Count for February
The past week also saw the monthly release of the global rig count for February, so we should be able to get an idea how the record low US rig count compares with what's going on elsewhere. Unlike the weekly count, the monthly Baker Hughes international count presents an average of the number of rigs running in each country for the month, rather than the total of those drilling at month end. February saw an average of 1,761 rigs drilling for oil and natural gas around the globe, which was down from 1,891 rigs that were drilling globally in January, and down from the 2,986 rigs that were deployed globally in February of last year. Once again, the lion's share of the 130 rigs that were pulled out worldwide came from the US, where the February count was down 122 from January's 532 rigs, and down from the 1348 rigs that were active in the US in February of 2015. But despite even lower prices for product than in the US, Canadian drillers still added 19 rigs for the month and averaged 211 in February, still down from the 363 drilling rigs that were deployed in Canada in February last year..
The Middle East saw rigs pulled out for only the second time in the last 7 months, as the region was down 3 rigs to 404, which was also down from the 415 rigs deployed in the Middle East a year earlier. On net, those reductions came from offshore platforms, as the region's offshore rig count fell from 55 in January to 50 in February, which was still up from 48 offshore platforms working in the Middle East a year ago. The big pullback in Middle East drilling was concentrated in Egypt, where they idled 7 rigs and hence had 35 remaining active, which was also down from 43 rigs in Egypt a year earlier. Qatar shut down 3 rigs; they now have 6 active, down from 10 a year earlier...and the Pakistanis also idled two rigs, and now have 21 active, down from 23 both last week and a year ago. The Saudis, on the other hand, added 4 rigs to bring their total active drilling rig count up to 128, up from the 124 rigs that were drilling in the Kingdom both last week and last February. The Kuwaitis also deployed an additional three rigs and averaged 43 rigs in February, which was still down from the 51 rigs they had deployed in February a year ago...
Meanwhile, the Latin American countries reduced their rig count by 6 to 237 rigs, after idling 27 rigs in January, 14 rigs in December, 10 rigs in November and 27 rigs in October, as that regional count is now down from a total of 355 rigs, which included 72 offshore rigs, that were working in February of 2015. Once again, Argentina saw the largest drilling pullback, as they were down by 7 rigs to 65, which was down from the 106 rigs that were in use in Argentina a year ago. Mexican drillers pulled out 4 rigs, leaving 39, which was down from the 63 rigs that were drilling in Mexico last February. On the other hand, Ecuador added 3 rigs and now have 4 active, which is still down from the 19 rigs that were drilling in Ecuador a year ago, and Venezuela added 2 rigs and now have 69 working, again down from the 72 rigs that were working in Venezuela a year earlier...
Elsewhere, the Asia-Pacific region had 182 drilling rigs working in February, down from 193 rigs in January. and down from 240 last February. The largest decrease in the region was in Australia, where they reduced their 13 rigs to 9, which was down from the 17 rigs the Australians were running a year ago. Thailand shut down 2 rigs, as did China offshore. That left Thailand with 16 rigs, the same as they had in February last year, and left 25 platforms drilling off the shore of China, down from 40 a year earlier...India added 2 rigs, and they now have 99, which is still down from they 108 they had deployed last February. At the same time, the rig count in Europe was down by 1 to 107 in January, which was down from 133 rigs working Europe a year ago, as the Dutch idled two rigs, leaving 2, which was down from 6 rigs working in the Netherlands a year ago.. Lastly, there were 6 rigs pulled out of Africa in February, as their rig count fell to 88, which was down from 132 rigs working in Africa a year earlier. Nigeria saw 3 of its rigs shut down, leaving them 6, which was down from 17 rigs last February, and Angola saw 2 rigs removed, leaving 8, which was down from 15 rigs working Angola a year ago. Note that Iranian, Russian, and Chinese rig counts are not included in Baker Hughes international data, although China's offshore area is included in the Asian totals here...
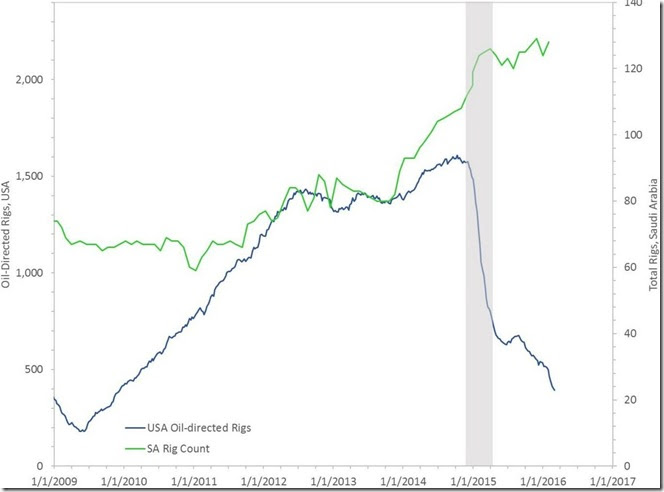
Since the US rig count has fallen to an all time low due to the lower prices, it’s an opportune time to compare the historical US rig count to that of the Saudis. The graphic below, from petroleum reservoir consultant Dwayne Purvis writing about the Saudi’s production capabilities at OilPrice.com, does just that, as it superimposes a graph of the Saudi rig count on top of one of the US rig count, going back to the depression year of 2009. The number of rigs drilling for oil in the US is indicated on the left margin and is shown in blue, while the number of rigs drilling for oil in Saudi Arabia is indicated on the right margin and is shown in green. We can see the US oil rig count quickly rose from under 200 to over 1300 as oil prices rose and the Fed’s monetary policy provided cheap and easy credit to US drillers, while Saudi drilling stayed relatively unchanged, with an average of about 66 rigs deployed yearly until 2012. With slightly higher oil prices in 2013 and 2014, the Saudis increased their drilling to include over 100 rigs, while the US drillers added rigs slowly and peaked at 1609 in October of 2014. Then the US rig count nosedived as oil prices fell from over $100 a barrel in mid-2014 to $40 in January of 2015, steadied briefly as oil prices recovered to $60 in the spring of last year, and then fell steadily as oil tanked to below $30 a barrel earlier this year. Meanwhile, Saudi drilling didn’t miss a beat; in fact, they’ve actually increased drilling as prices fell, and the 128 rigs they had deployed in February was only one rig away from the Saudi record high of 129 rigs they were running in December…
Note: the above was excerpted from my weekly coverage at Focus on Fracking…


Comments
wow
That's just an incredible shrinkage. Thanks for writing this, I had no idea!
does not bode well for industrial production
the "mining sector" was the drag on Industrial Production all last year
rjs