Welcome to the concentrated boiling up of economic graph-o-rama absurdity and horror in number form. Every week, economic data pours in and some damning statistics go flying by with nary a nod.
Financial Crime Prosecutions
Syracuse University, through their Transactional Records Access Clearinghouse, analyzed Justice department data. They found the number of prosecutions for financial fraud is dramatically down, 28.6%, from just five years ago.

Federal prosecutions for financial institution fraud have continued their downward slide despite the financial troubles reported in this sector. The latest available data from the Justice Department show that during the first eleven months of FY 2011 the government reported 1,251 new prosecutions were filed. If this activity continues at the same pace, the annual total of prosecutions will be 1,365 for this fiscal year, down 28.6 percent from their numbers of just five years ago and less than half the level prevalent a decade ago.
Think about it, this is the time of the housing bubble, mortgage fraud, bail outs and bank failures, yet actual criminal prosecutions of financial related crime dropped? Whose yer daddy now.
Number of Jobs Created Dramatically Down
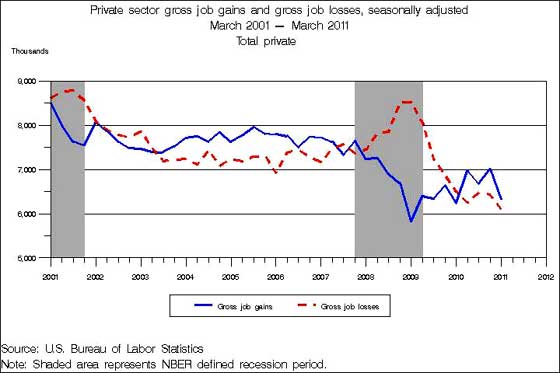
A more obscure BLS economic report, Business Employment Dynamics, shows businesses opening was dramatically down for Q1, the lowest since the BLS has been keeping track of new and failing business establishments. Over the last decade we see job creation decline as well as the percentages from new establishments. Below is a graph showing the private sector gross job growth, (blue), and gross job loss, (red), for the last decade.

From December 2010 to March 2011 the number of gross job gains from opening and expanding private sector establishments was 6.3 million, a decrease of 671,000 jobs compared to the previous quarter.
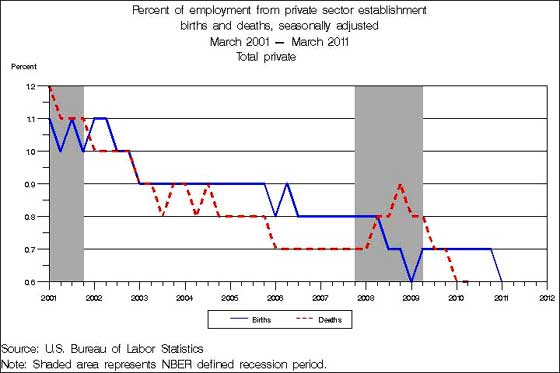
Below are the percentages of gross job gains, (blue), against gross job losses, (red), due to birth/death model. The birth/death model are the number of new businesses started versus the establishments which went out of business.

Over the same period, gross job losses from closing and contracting private sector establishments fell to 6.1 million, the lowest level since this series began in September 1992.
The lack of new business establishments is simply not a good sign, in spite of 2000 being the dot con era.
Prozac Nation
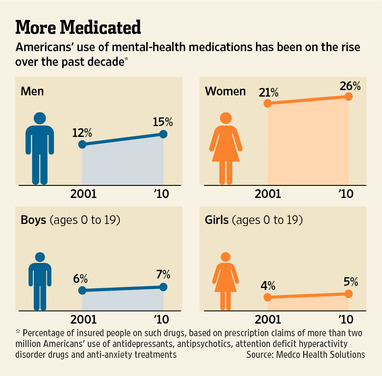
Psychiatric drug use grew 22% 2001-2010. 1 in 5 Americans are on some type of chemical. The below Wall Street Journal graph, shows the breakdown by sex. Ladies, what the hell?

Among the most striking findings was a big increase in the use of powerful antipsychotic drugs across all ages, as well as growth in adult use of drugs for attention-deficit hyperactivity disorder—a condition typically diagnosed in childhood. Use of ADHD drugs such as Concerta and Vyvanse tripled among those aged 20 to 44 between 2001 and 2010, and it doubled over that time among women in the 45-to-65 group.
Guess who's making out like a bandit, yup, big pharma.
Psychiatric medications are among the most widely prescribed and biggest-selling class of drugs in the U.S. In 2010, Americans spent $16.1 billion on antipsychotics to treat depression, bipolar disorder and schizophrenia, $11.6 billion on antidepressants and $7.2 billion on treatment for ADHD, according to IMS Health, which tracks prescription-drug sales.
Mobility at Record Low
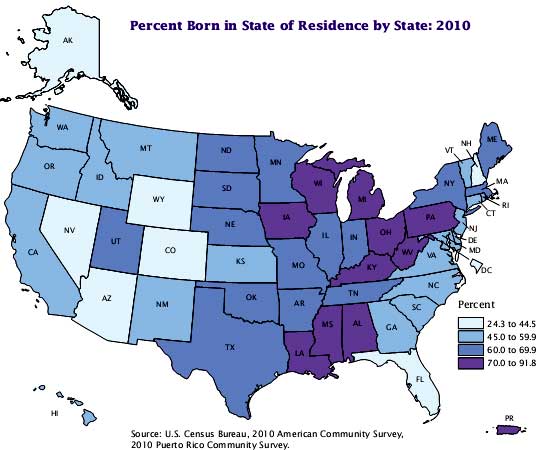
People move around, or at least they used to. The Census reported mobility is at a record low. Moving costs money and usually means a job. Below is a map showing the percentage of people who live in the state they were born in.

The percentage of people who changed residences between 2010 and 2011 ─ 11.6 percent ─ was the lowest recorded rate since the Current Population Survey began collecting statistics on the movement of people in the United States in 1948, the U.S. Census Bureau reported today. The rate, which was 20.2 percent in 1985, declined to a then-record low of 11.9 percent in 2008 before rising to 12.5 percent in 2009. The 2010 rate was not statistically different than the 2009 rate
For those who moved to a different county or state, the reasons for moving varied considerably by the length of their move. According to Geographical Mobility: 2008 to 2009, when people moved a considerable distance between 2008 and 2009 ─ 500 or more miles ─ it was most likely for employment-related reasons, which were cited by 43.9 percent of such movers, as opposed to housing-related reasons, given by 11.6 percent. Conversely, when people didn't move far ─ less than 50 miles ─ 40.0 percent did so for housing-related reasons.
Please consider sharing with the rest of the class any shocking statistic that made your jaw drop while no one else seemed to notice.

Comments
Awesome round-up
We are aware of this stuff, it's kinda in the air. But to actually see it in hard numbers ... awesome.