The BEA economic report personal income & outlays was released last Wednesday, but since PCE greatly affects GDP, it's worth reviewing, despite the tardiness of this piece.
Personal income increased 0.5% in October and PCE or personal consumption expenditures increased 0.3%. In September personal income was a big fat 0%. Below is the percent change in personal income and then the raw values.
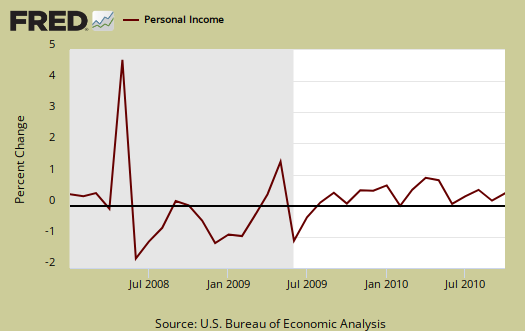
Real disposable income increased 0.3 percent in October, in contrast to a decrease of 0.2 percent in September.
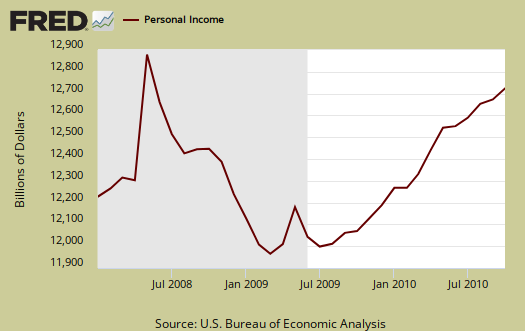
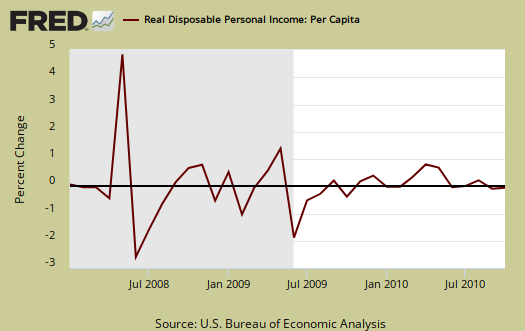
Personal income moved! It budged, yet is it all that great of news? Below is real disposable income per capita. Per capita means evenly distributed per person.
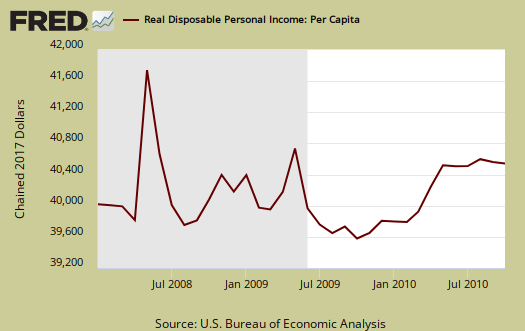
Pretty flat huh? The population in the U.S. increased 241,000 in a month. So, what sounds really good initially, if one looks at population growth, not so great.
Personal consumption expenditures is the largest part of GDP, so a 0.3% increase isn't great but better than last month. Below is a graph of real PCE.
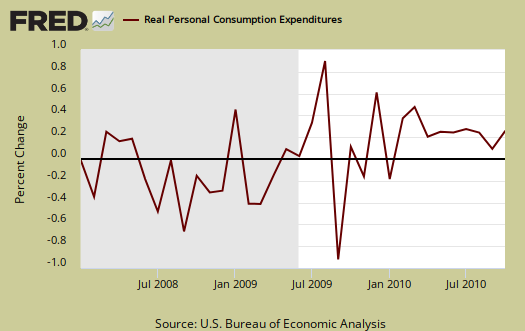
For the first month of the 3 which make up Q4 GDP, or October, November and December, it's looking similar to the Q3 GDP report for Consumption.
Personal Savings was also up with a 5.7% rate of DPI (disposable personal income).
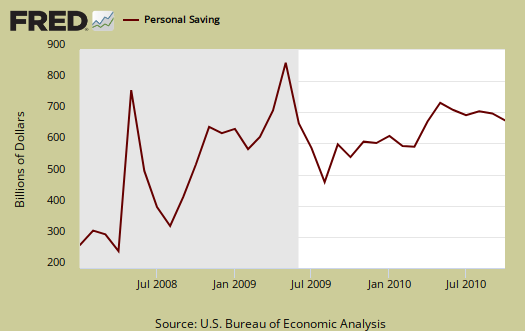
The good news is personal income increases are a result of wages and salaries.
Private wage and salary disbursements increased $33.2 billion in October, compared with an increase of $8.0 billion in September. Goods-producing industries' payrolls increased $5.5 billion, in contrast to a decrease of $0.1 billion; manufacturing payrolls increased $3.4 billion, in contrast to a decrease of $0.1 billion. Services-producing industries' payrolls increased $27.6 billion, compared with an increase of $8.2 billion. Government wage and salary disbursements increased $2.5 billion, in
contrast to a decrease of $4.6 billion.
Below is personal income minus transfer payments. This graph shows how much personal income increased that wasn't funded by the government. Transfer payments are payment from the government to individuals where no actual services (work) was performed. This includes social security, unemployment insurance, welfare, veterans benefits, Medicaid, Medicare and so on.
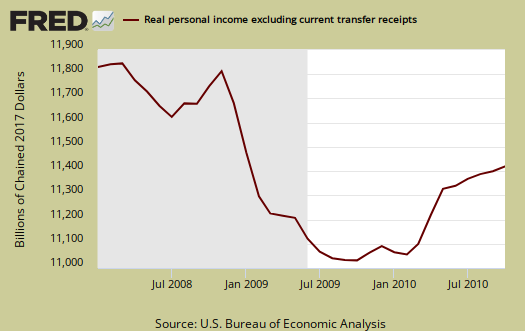
So, this report isn't great, but considering how the U.S. middle class is under attack and grave worries about GDP declining, it's better than nothing.
To visualize more data from this report, consider playing around with more of the St. Louis Federal Reserve Fred graphs.

Recent comments