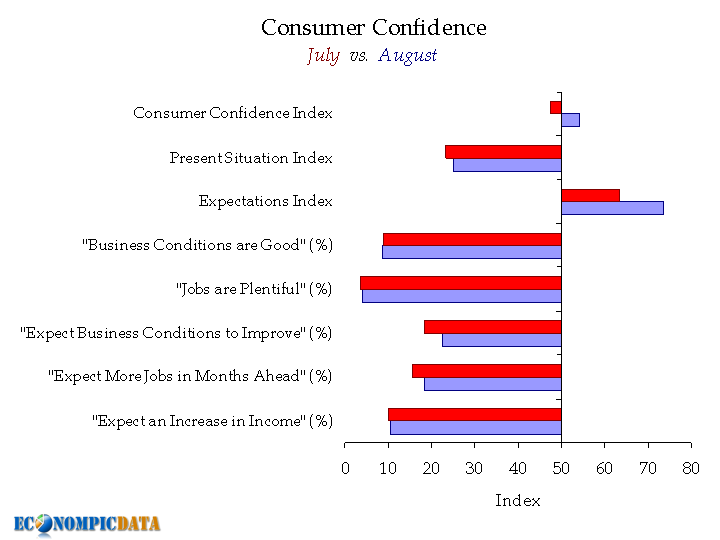
EconomPic has a great graph from The Future's So Bright on Consumer Confidence index from July to August:

Src: EconomPic, click graph to enlarge
Now read the headlines reporting on the consumer confidence index, with phrases like soars, surges, jumped...
Does the above graph look like a blow out to you?
Here is the Conference Board report:
The Conference Board Consumer Confidence Index®, which had retreated in July, rebounded in August. The Index now stands at 54.1 (1985=100), up from 47.4 in July. The Present Situation Index increased slightly to 24.9 from 23.3 last month. The Expectations Index improved to 73.5 from 63.4 in July.
Consumers' assessment of current conditions improved slightly in August. Those claiming business conditions are "bad" decreased to 45.6 percent from 46.5 percent, however, those claiming conditions are "good" decreased to 8.6 percent from 8.9 percent. Consumers' appraisal of the job market was more favorable this month. Those saying jobs are "hard to get" decreased to 45.1 percent from 48.5 percent, while those claiming jobs are "plentiful" increased to 4.2 percent from 3.7 percent.


Expectations Index
The Expectations Index is such an outlier that I have to question what questions it is asking and how it is created.
stock market, case-shiller
The questions actually are on the conference board survey and in Econompic's graph too.
But ya know, perception vs. what's real?
I didn't comment on the case-shiller, might have done a "links" for it with various opinions....
I mean I just not real happy with prices being out of reach for most people period. I know that implies a lot of negative equity on the other side.
But one thing is the stock market has been on fire lately and it looks like they all believe a "V" full bore recovery or something. Talk about something not matching other economic data as well as other markets....