I thought I'd add a little documentation supporting Robert Oak's recent posting.
"News Flash - Women are Equal to Men - in Terms of Losing Their Careers!"
The BLS Employment to Population ratio, also supports my posting concerning the under-perfomance of this decade's employment growth, relational to population growth.
"Last Century's immigration policy no longer works for US"
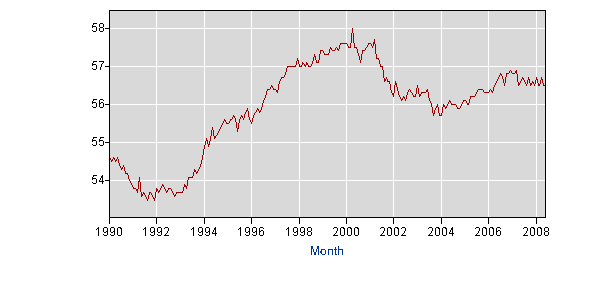
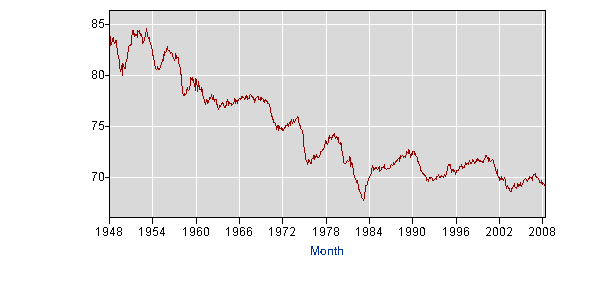
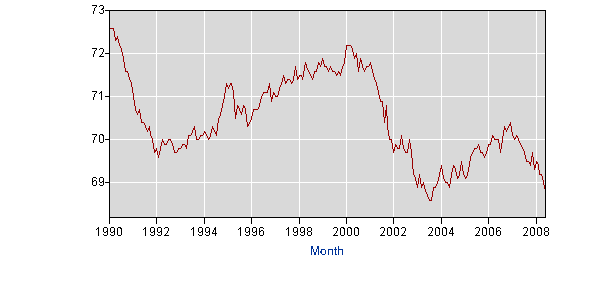
The BLS "Employment to Population ratio" is a telling statistic, but more telling if we view the data of women and men separately. Posted here are Employment to Population ratio charts provided by the BLS.
Employment-population ratio (Current Population Survey)
"The proportion of the civilian noninstitutional population aged 16 years and over that is employed. " http://www.bls.gov/bls/glossary.htm#E
These charts support the conclusion that employment trends for women are now conforming with the downward trends that men have been experiencing for many years.
There are curently 120,598,000 women in the BLS Civilian noninstitutional population, 68,097,000 are Employed. A total of 21,116,000 women are 65 years of older, of these 2,600,000 are employed.
(Correct me if I'm wrong, but a one percent swing in the employment to population ratio for women is 12.5 million jobs, if the population levels became static.)
Employment to population ratio Women 16 yrs and over 1948 to June 2008

Employment to population ratio Women 16 yrs and over 1990 to June 2008

Source:
Series Id: LNS12300002
Seasonal Adjusted
Series title: (Seas) Employment-Population Ratio - Women
Labor force status: Employment-population ratio
Type of data: Percent
Age: 16 years and over
Sex: Women
Employment to population ratio Men 16 yrs and over 1948 to June 2008

Employment to population ratio Men 16 yrs and over 1990 to June 2008

Series Id: LNS12300001
Seasonal Adjusted
Series title: (Seas) Employment-Population Ratio - Men
Labor force status: Employment-population ratio
Type of data: Percent
Age: 16 years and over
Sex: Men
There are curently 113,029,000 men in the Civilian noninstitutional population, 77,794,000 are Employed. A total of 15,994,000 men are 65 years or older 3,279,000 are employed.
The number of retiring workers is not enough persons to affect the Employment to Population Ratio.
Population Growth Persons Attaining Age 65
1999 = 247,000
2000 = 982,000
2001 = 206,000
2002 = 136,000
2003 = 445,000
2004 = 356,000
2005 = 459,000
2006 = 545,000
2007 = 615,000
( Number of persons - not in thousands)
Series Id: LNU00000097
Not Seasonally Adjusted
Series title: (Unadj) Population Level - 65 yrs. & over
Labor force status: Civilian noninstitutional population
Type of data: Number in thousands
Age: 65 years and over
Source: www.bls.gov
Labor Force Statistics from the Current Population Survey
July/23/2008

Comments
oooo
These are some wild numbers! I have to think about this, but one thing is you obviously did a lot of number crunching, which is good. First pass I don't see any holes, in your stats, but let me mull, this is making my head explode.
Wild numbers
Actually, the Employment to population ratios charts are a simple query against the BLS database, I simply copied and uploaded the BLS charts.
I looked up and pasted the current population and employment numbers. (added the 000's to convert from "numbers in thousands" to true numbers)
The "Growth in age 65 attained" is simply current year minus prior year.
Kind of trashes the Unemployment statistic?
labor econ
it's not jiving with the stats on wage decline on "native" (I didn't make up that term, it's a labor economics term to mean citizens vs. immigrants) income and the impact from immigration on their wages.
Another element here is outsourcing. We now have global sourcing of jobs which assuredly (although the stats are few and far between) have affected US employment numbers.
Anyway, I don't think one can make any correlations or conclusions from just these raw numbers, although it is interesting.
It does trash the unemployment statistic
This tells much of the story:
This comes a report by the Cleveland Fed about labor participation rates in the US and Ohio.
The story that you get about unemployment depends a great deal on the way you calculate the labor pool. The decline in labor force participation is particularly striking when you look at men. In the 50's it was 86%, but now it's down to something like 74%.
What's driven the increasing participation rate has been increasing participation by women in the workplace. Which is positive if it reflects increased freedom for women to enter the workforce, but just might be negative if instead it indicates that families are dealing with decreasing wages by having both parents work instead of one.
I'd like to be able to go through, and run unemployment numbers state by state using the participation rate for males in 1970 (79.7% nationally) as compared to today (75.9% in 2005). If you use employment-population numbers, you get prisoners and others in the mix. There's a good argument they should be included in the unemployment numbers, but that's another discussion.
Using this release
We find that in June 2008 the male unemployment rate (over 20) was 5.8% with a 75.9% participation. This generates a male labor force of 79.291 million. If we increase the participation rate to 1970 levels, then the male labor force grows to 83.183 million. And there are 75.402 million employed in this group. Which means that using 1970 male participation rates, there are 7.781 million unemployed out of a labor force of 83.183 million.
Put another way the male unemployment rate would rise to 9.4% if the male participation rate were the same as it was in 1970. Again, 9.4% unemployment.
yeah but
I don't have it off hand, but I know analysis of women participating it the labor market never was a displacement issue for the economy grew, women were working extensively as industrialization took off (the idea they were at home baking cookies isn't statistically accurate) and then the native population was rolling down on top of it.
and how about the number of households in the United States where there are two adults in them?
The percentage of married households is about 51%, so assuming that households have two adults to make it I'm not so sure that's a valid statistic. I mean how many people do you know who have stayed married more than 3 years? ;) I think married couples are a minority in the United States. We could up those numbers with live togethers and gay couples, long term financially joined, but still it's a huge percentage of households where it is implied there is only one adult bringing home the bacon so to speak.
But, this is a very good topic. I know the John Williams (shadowstats.com) says the unemployment rate should be 2x to 3x higher than reported and I certainly agree with that. The underemployment rate I would love for someone to expand upon further.
I think that the real question
is why have male labor participation rates declined?
And what's the correlation between this and the decline of manufacturing?
yeah but
I dug around the BLS query interface. The marital status "married, spouse present" is not available in all age groups. Age group 25 and over has "married, spouse present", but the employment to population ratio is not available.
I guess that, a proxy could be created w marital status percentage pushed accross available EPR data. Sounds like a giant spreadsheet.
Good post.
Included are persons 16 years of age and older residing in the 50 States and the District of Columbia who are not inmates of institutions (for example, penal and mental facilities, homes for the aged), and who are not on active duty in the Armed Forces
http://www.bls.gov/bls/glossary.htm#C
http://www.bls.gov/bls/glossary.htm#E
The labor force includes all persons classified as employed or unemployed in accordance with the definitions contained in this glossary.
The labor force as a percent of the civilian noninstitutional population.
http://www.bls.gov/bls/glossary.htm#L
Taken as a whole, the employment to population ratio's don't look that alarming until recently.
I believe that one percentage point would be 23.6 million jobs. (I think the BLS graph can be pasted directly -- we'll see)
Correlation & Conclusions
A correlation I noticed, and left out of the blog (on purpose), is the men's the long-term linear (declining) employment trend has not really changed. The long-term trend for women, shows a departure, from a historical inclining trend, in year 2000 and hasn't recovered.
Men's employment growth is continuing to decline, while Women's employment growth is now flat or possibly declining.
Possible conclusion:
If men aren't taking women's jobs and vice-versa, the other variables are employment growth/loss and population growth/loss.
There is a similar trend in the College degreed employment. Employment Growth to NCES Bachelors degree production graph.
<Here>
The graph shows employment ratio declines starting in 2000, after seven years of very comensurate growth.
labor participation rate
I just went looking through my Labor Economics text (Borjas), and found labor force participation rates for males in 2002 at 87.1% and women at 72.7%. So something is askew here. He quotes BLS, current Population survey 2002.
But that said, I went looking for the decline in male labor participation rate. (He has this also). Now he goes on about a strong correlation to increased retirement benefits and early retirement as a cause. Then he goes on further about claiming social security disability benefits as an incentive and such an incentive the government had to make harsh requirements. uh, huh. What is Social security disability? I think that gives people enough money for bus fare to go beg on the streets during the day as I recall.
uh, I need another labor economics text after reading that. Who here believes that men are retiring earlier because of the benefits? Now haven't we read report after report (two new GAO reports right in the right hand side!) about how the United States retirement system is in deep dodo, as well as all trying or who have retired? So, I don't think so! I think age discrimination probably has a much stronger correlation on that one.
So....good question and now I need another reference for while Borjas 2002 graph doesn't match at all, his other one for does match exactly to Weavers!
I'll bet manufacturing decline does have something to do with the decrease. (although I'm not so sure for women made a lot of inroads into manufacturing, but I think women's participation slope (increase) in the labor participate rates does overlap (correlate) to the decline of US manufacturing possibly). i.e. while they are coming in, them jobs were shipping out!
Offhoring - and the BLS data
Robert,
I recall one recent EP poster who noticed that the BLS has made adjustments/revisions all the way back to 2002.
Again, I'm just pulling the current stuff from BLS.
Paul Craig Roberts has done a lot of work on the McJobs coming in and the skilled/manufacturing going offshore, but let's look at the population growth for a moment.
The Census in 2005 places 14 and 15 year olds at 8,549,000.
To find the number of 15 year olds, divide by 2 = 4,274,500.
The CDC places annual deaths at about 2.4 million, which puts domestic growth at 2,137,500 for 2005.
Census:
http://www.census.gov/population/socdemo/school/cps2005/tab01-01.xls
CDC Deaths:
http://www.cdc.gov/nchs/data/nvsr/nvsr55/nvsr55_19.pdf
So population growth from our kids is roughly about 2.1 million per year. Now let's look at the jobs we've created for them.
Growth in employment is taken from the BLS publication:
Series Id: LNU02000000
Not Seasonally Adjusted
Series title: (Unadj) Employment Level
Labor force status: Employed
1990 = 1,451,000
1991 = (1,075,000)
1992 = 774,000
1993 = 1,767,000
1994 = 2,801,000
1995 = 1,840,000
1996 = 1,808,000
1997 = 2,850,000
1998 = 1,905,000
1999 = 2,025,000
2000 = 3,403,000
2001 = 42,000
2002 = (448,000)
2003 = 1,251,000
2004 = 1,516,000
2005 = 2,478,000
2006 = 2,697,000
2007 = 1,620,000
On an annual basis the only recent times we've lost jobs is 1991 abd 2002.
Here's an anomally, if I avoid the Bush "population controls" by using Dec. to Dec. instead of the annual the employment growth numbers look a lot different.
1990 = 412,000
1991 = (715,000)
1992 = 1,595,000
1993 = 2,588,000
1994 = 3,151,000
1995 = 407,000
1996 = 2,767,000
1997 = 2,882,000
1998 = 1,947,000
1999 = 1,964,000
2000 = 3,150,000
2001 = (1,577,000)
2002 = 330,000
2003 = 1,957,000
2004 = 1,722,000
2005 = 2,640,000
2006 = 3,163,000
2007 = 253,000
In any case, it's very rare that employment has surpassed domestic population growth.
I'm going to sleep on this one and revisit in the morning.
diverging data
Yeah, my Borjas textbook is 2nd edition, which means the graphs are quite dated. I still think his explanation is bogus. ;)
Does Roberts have detailed analysis? I've just read his opinion pieces which are more overview on how the United States is being sold down the river vs. more of the Academic like analysis stuff. He's an economist so obviously he could wipe out the details.
The issue is
that the Borjas text uses the labor participation rate, while this uses the employment to population rate.
The labor participation excludes the institutionalized population, aka prisoners and the like.
Boirjas, Prisoners, Military, Institutionalized
I think Borjas is partially correct when observing the historical data. Disability, Social Security, OSHA have changed the equation, back when men where the primary providers, men simply worked themselves to death, or were killed on the job.
Also, welfare may have become more socially acceptable through the generations, however welfare is no longer available to able bodied single men. I don't think that these reasons address the more recent decline in men's employment.
The inclusion of prisoners appears to be incorrect???
Perhaps the following definition of the Civilian noninstitutional population hasn't been updated? This is the second comment reference to the incarcerated as being included in the population survey.
Alternately, when using the Labor Force Participation Rate, NILF (not in the labor force) and discouraged workers are not included. "Labor Force" strictly is defined as the employed plus the unemployed (U-3).
Civilian noninstitutional population (Current Population Survey):
Included are persons 16 years of age and older residing in the 50 States and the District of Columbia who are not inmates of institutions (for example, penal and mental facilities, homes for the aged), and who are not on active duty in the Armed Forces.
Labor force (Current Population Survey)
The labor force includes all persons classified as employed or unemployed in accordance with the definitions contained in this glossary.