ADP's proprietary private payrolls jobs report shows yet another solid month of strong private sector job gains. For November, ADP reports a monthly gain of 208,000 private sector jobs. October's ADP private payroll gains were a revised 203,000. Small businesses drove the payroll gains. By ADP's survey, this is the eighth consecutive month where their reported private job gains are above 200 thousand. This report does not include government, or public jobs. The official BLS employment report for September will be released on Friday.

ADP's reports in the service sector alone 176,000 private sector jobs were added. The goods private sector gained 32,000 jobs with 17,000 of those jobs in construction. Professional/business services jobs grew by 37,000. Trade/transportation/utilities showed strong growth again with 49,000 jobs. Financial activities payrolls added 5,000 jobs. Manufacturing added 11,000 jobs,back to it's mediocre showing. Graphed below are the monthly job gains or losses for the five areas ADP covers, manufacturing (maroon), construction (blue), professional & business (red), trade, transportation & utilities (green) and financial services (orange).

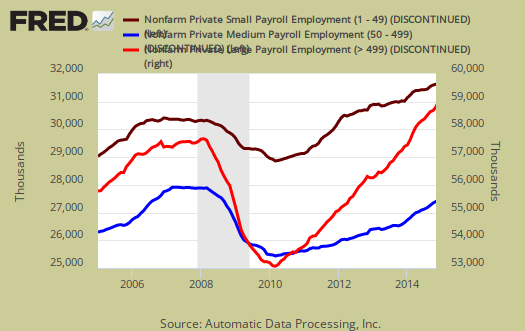
ADP reports payrolls by business size and this month small business added almost half of the jobs. Small business, 1 to 49 employees, added 101,000 jobs with establishments having less than 20 employees adding 48,000 of those jobs. ADP does count businesses with one employee in there figures. Medium sized business payrolls are defined as 50-499 employees, added 65,000 jobs, which the report noted was significantly down from last month. Large business added 42,000 to their payrolls. If we take the breakdown further, large businesses with greater than 1,000 workers, added 32,000 of those large business jobs.
Below is the graph of ADP private sector job creation breakdown of large businesses (bright red), median business (blue) and small business (maroon), by the above three levels. For large business jobs, the scale is on the right of the graph. Medium and Small businesses' scale is on the left.
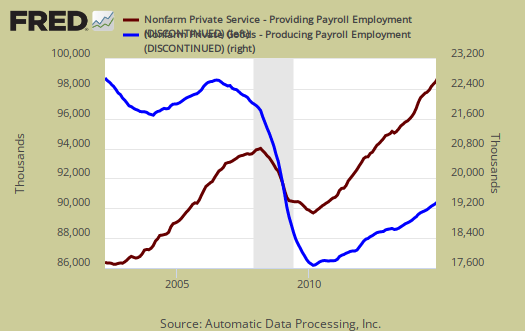
One of the more interesting aspects of the ADP report is the breakdown of the private sector by service producing and goods producing jobs. The service sector are disproportionately lower paying jobs as a whole in comparison to goods producing jobs, even while including the financial, professional and business services sectors are part of services. Below is the graph of ADP service sector (maroon, scale left) jobs against their goods production jobs (blue, scale right).
The ADP employment report, if it matches the BLS official unemployment report, would overall imply overall enough job growth to keep up with population, as ADP reports just the private sector job growth. The U.S. needs about 115,000 jobs per month, minimum just to keep up with population growth, abet with the same lousy, artificially low, labor participation rates.
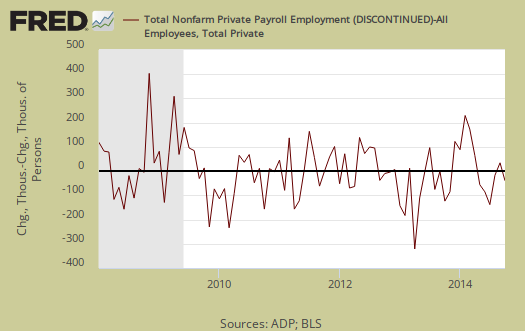
The ADP private payrolls rarely matches the BLS monthly employment figures. The monthly BLS jobs survey (CES) has a 100,000 payroll jobs overall margin of error. ADP changed their methodology and now claim to match the BLS private payrolls, but only historically, after revisions. The below graph shows shows how many private sector payroll jobs, each month, ADP was off by in comparison to what the BLS reported. This is a monthly graph, not cumulative. As we can see, it's been rare where the two monthly reports get the exact same private payrolls growth numbers. When the below graph bar is negative, that means the BLS reported a larger number of private jobs than ADP did, when the graph bar is positive, it means ADP reported larger private payrolls. Again, compared are private sector jobs which is different from the BLS headline number. The graph will be updated with the BLS jobs figures released on Friday.
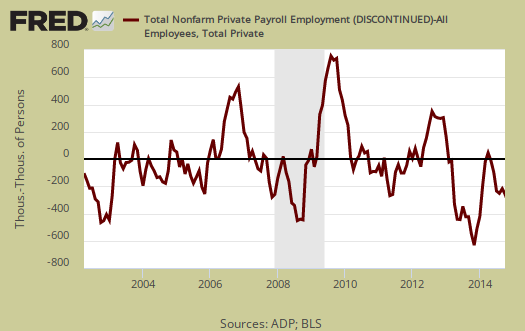
Below is the cumulative difference between what the ADP reports as the private nonfarm payroll jobs vs. the BLS (ADP minus BLS). This line shows the divergence, over time in number of nonfarm private payroll jobs reported between the two reports. Due to annual revisions, ADP and the BLS are matching up once again in reported cumulative private sector jobs. Regardless, one cannot infer from the ADP report what the BLS figures will show on new releases. ADP claims their private payrolls cover 24 million jobs with 416 thousand businesses in the U.S. This represents about 20% of U.S. payrolls. The graph will be updated with BLS private non-farm payrolls data.
The graph below is the monthly change of private jobs as reported by ADP. At the absolutely bare minimum, the United States needs 1.2 million jobs per year, or 100,000 per month, total jobs, including public sector jobs, to keep up with additional new workers in the labor supply caused by population growth with the current terrible labor market conditions assumed.
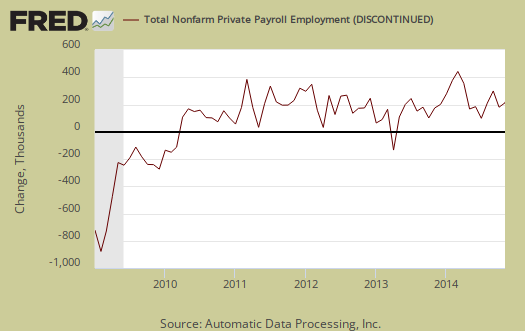
Regardless of the statistical differences between ADP and the BLS, these payroll figures are steady as she goes as economist Zandi implied. Yet it also implies America is not really getting the job growth we need to re-employ the millions dumped to the curb starting in 2008. Another problem is the type of jobs gained. Over and over we see the service sector greatly expand and here are where many lowing paying, part-time jobs reside.
Here are our overviews from previous months, only graphs revised. This article goes into the methodology details on the ADP report changes and compares historical data of the two methodologies in graphs.
ADP themselves have some great visuals on their website for more perspectives, breakdowns and charts of their statistics.

69,000 more "not in the labor force"
92,447,000 (Nov) MINUS 92,378,000 (Oct) = 69,000 more "not in the labor force"
http://data.bls.gov/timeseries/LNS15000000
Total nonfarm payroll employment increased by 321,000 in November, but the unemployment rate remained unchanged at 5.8 percent.
From VOX Study on Temp Workers: "The findings of this study on the effects of temporary work on individuals’ skills has important ramifications for the U.S., where short-term contracting is even more common than in Europe. The first is that workers are harmed by this practice, and not just via stress or having uncertain income. But second is that employers over time also suffer by degrading the capabilities of the labor pool."
http://www.nakedcapitalism.com/2014/12/temporary-work-bad-cognitive-heal...
Dean Baker: "Given the continuing weakness of the labor market, it is not surprising that workers are still seeing little of the benefits from economic growth ... A weak labor market leads to a situation in which most workers don't benefit from economic growth. Unfortunately we are still far away from getting to a point where we can anticipate substantial real wage gains, even if the November jobs numbers are a step in the right direction."
http://www.cepr.net/index.php/blogs/beat-the-press/more-on-the-continuin...
Canadian part-time workers: "The Great White North also published its latest jobs numbers on Friday ... We noted that about half of the total job growth in the prior 12 months had taken the form of part-time work, and that for women 25 and older, full-time employment had actually fallen."
http://ftalphaville.ft.com/2014/12/05/2062831/canadian-part-time-worker-...
disposable worker syndrome
throw away people. Sorry the overviews are so late, working on them now.
Disposable Employee Model
"What’s the worst thing about the Disposable Employee Model? It teaches workers that they’re replaceable, and they know that if they speak up against their employer they will be gotten rid of and replaced by someone else. Will that new employee be better? Probably not. But it doesn’t matter." ~ Amanda D, disposed-of employee
"Our bosses have found a way to get by without explicitly intimidating their workers--as long as we believe that we are disposable and can be easily replaced, we will take it upon ourselves to be as agreeable as possible, and never even consider standing up for what's best for us." ~ Emma BB, disposed-of employee.
(From a post I just renamed to "Disposable Worker Syndrome")
http://bud-meyers.blogspot.com/2014/02/foreign-job-creators-suck-too.html
Missing workers are "missing"
Bill McBride at Calculated Risk on 12/07/2014 (re: Decline in the Labor Force) writes: "Many estimates of 'missing workers' are probably way too high."
http://www.calculatedriskblog.com/2014/12/decline-in-labor-force-partici...
My question: Just since the Great Recession officially ended in June 2009, we've had an additional 11 million+ "not in the labor force". So how many of THOSE would he consider "missing"?
Stats:
http://bud-meyers.blogspot.com/2014/08/since-recession-ended-11-million-...
honestly I'm playing catch up
While I like Bill and most of the time he is spot on, when it comes to this, I think he misfires. I think EPI is closest to "right" on how many are "missing".
Just did the CPS overview and the thing to look at is not in labor force want a job now, about 3/4 down in the overview.