According to the Mortgage Monitor for August (pdf) from Black Knight Financial Services (BKFS, formerly the LPS Data & Analytics division), there were 912,898 home mortgages, or 1.80% of all mortgages outstanding, remaining in the foreclosure process at the end of August, which was down from 935,460, or 1.85% of all active loans that were in foreclosure at the end of July, and down from 2.66% of all mortgages that were in foreclosure in July of last year. These are homeowners who had a foreclosure notice served but whose homes had not yet been seized, and July's so-called "foreclosure inventory" was the lowest percentage of homes in foreclosure since early 2008. New foreclosure starts also fell in August after rising in each of the previous three months, as the 81,612 homes foreclosed on in August was 10.0% lower than the 90,690 foreclosures started in July and 24.2% lower than the 107,552 foreclosures started in August of last year...
In addition to homes in foreclosure, August data showed that 2,994,567 mortgage loans, or 5.90% of all mortgages, were at least one mortgage payment overdue but not in foreclosure, up 4.9% from 5.64% of homeowners with a mortgage who were more than 30 days behind in July, but down from the delinquency rate of 6.20% a year earlier. Of those who were delinquent in August, 1,143,222 home owners were considered seriously delinquent, which means they were 90 or more days behind on mortgage payments, but not in foreclosure at the end of the month. Thus, a total of 7.70% of homeowners with a mortgage were either late in paying or in foreclosure at the end of August, and 4.06% of them were in serious trouble, ie, either "seriously delinquent" or already in foreclosure at month end.
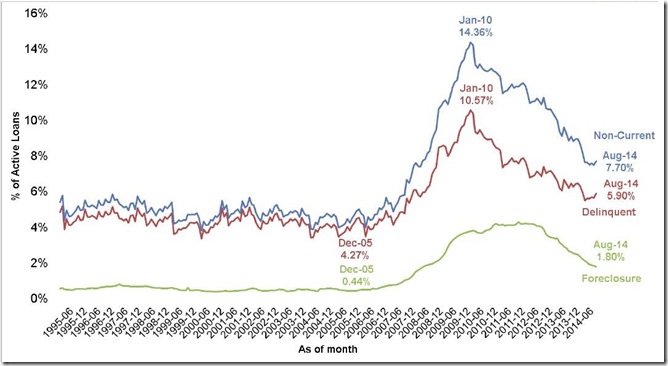
The graph below, from page 13 of the Mortgage Monitor pdf, shows the percentage of mortgages that were in the foreclosure process monthly since 1995 in green, the percentage of active home loans that were delinquent but not in foreclosure over the same period in red, and the total of both, representing total percentage of mortgages that were in some kind of mortgage trouble each month, in blue over the same period. We can see that the percentage of homes in foreclosure in green has been falling fairly steadily over the last two years and at 1.80% in August is now well below the October 2011 peak of 4.29% of mortgages in the foreclosure process. But notice that's still more than 4 times the pre-crisis foreclosure inventory of 0.44% from December 2005 that’s highlighted on the graph, so the percentage of homes in foreclosure is still a long way from normal. Similarly, with delinquent mortgages shown in red at 5.90% of all mortgage outstanding in August, while up seasonally from the 5.52% delinquency rate in May, is down to nearly half of the 10.57% of all mortgages that were delinquent but not in foreclosure at the peak of the mortgage crisis in January of 2010, but still above the December 2005 mortgage delinquency percentage of 4.27% noted on the graph. Note also the seasonality of mortgage delinquencies apparent in the track of the red graph below, wherein they usually begin to increase at the beginning of the school year and peak during the holidays, and then decline at the beginning of the year as homeowners catch up on all their bills after holiday shopping.. With the recent release of the iphone6, we can also expect another increase in mortgage delinquencies in September, as they have increased each time previously a new Apple product was launched..
One of the special focal points of this month's mortgage monitor report was an analysis of what had since happened to those homeowners who were in foreclosure at the end of last year. From page 15 of the Mortgage Monitor's presentation, the following pie graph is a graphic representation of the August status of those who were in foreclosure at the end of December.. As you can clearly see, nearly half of the pie is purple, representing the 49% who were in foreclosure at the end of 2013 who are still in foreclosure today. Meanwhile, the teal wedge of the pie indicates that 23% who were in foreclosure in December had since had their homes seized, and those loans are now listed as 'REO', or real estate owned by the mortgage holder. In orange, we see that 4% of those in foreclosure in December have reached an agreement with their banker to sell their house to a third party, often as a "short sale", for less than the amount owed. The light blue wedge represents the 2% who somehow came up with the funds to pay off their mortgage, & hence now own their homes free & clear. Also no longer in foreclosure are the 8% who are current, shown in dark blue, and the 2% those who caught up on their payments and are now again 30 days behind, shown in red, and also the 12% in green, who are those who are more than 60 days delinquent, but no longer in foreclosure at the end of August. As we learned from the July report, 53% of foreclosure starts are in this group who paid up and got out of foreclosure, only to fall behind and be foreclosed on again...
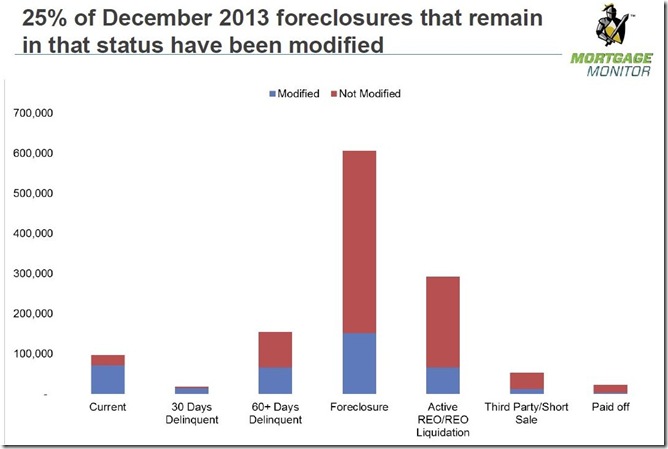
The next graphic, a bar graph from page 16 of the pdf, shows the count and hence the percentage of each of those 2013 foreclosure situations shown above that have been modified over the ensuing 8 months, The count of those that have been modified, accounting for 25% of the total, is shown blue in each bar for each situation shown in the pie above, while the red section in each bar represents those that have not been modified. For instance, of the roughly 100,000 who were in foreclosure in 2013 who are now current, which is shown in the first bar, about 25% received a mortgage modification that helped them get current; similarly, for the 610,000 mortgages that are still in foreclosure 8 months later, 25% of them also had their mortgages modified, but still not enough to lift the foreclosure. We can also see that in the bars on the far right, representing those who've sold their homes or who paid off their mortgage, very few had their mortgages modified. On the other hand, of those who are now 30 days delinquent, almost all had a mortgage modification.. Similarly, for those who who are 60 days delinquent, almost half had a mortgage modification, but nonetheless have already missed two payments. Although not included this month,. the July mortgage monitor (pdf) had several graphs further breaking down the various types of modifications delinquent mortgages have undergone, including the state level data on plate 11.
The next graphic, from page 20 of the August Mortgage Monitor, first shows us the total count of mortgages that have been 90 days or more delinquent but not in foreclosure for every six months over the duration of the mortgage crisis, and then it gives us a color coded representation of the length of time that those seriously delinquent mortgages had been delinquent in each of those June and December bar shaped snapshots. The first bar is June 2009, & then the highest bar is December 2009, one month before the peak of the crisis.. Within each bar, the percentage of seriously delinquent mortgages that were 3 to 6 months behind on payments is shown in blue, the portion of seriously delinquent mortgages that were 7 or 8 months late is shown in red for each month shown, the percentage of seriously delinquent mortgages that were 9 to 11 months behind is shown in green, while those mortgages that are 12 or more months behind on payments are shown in purple in each bar. The last bar shows August details; note the blue 3 to 6 month delinquencies at 44% for August are at the highest proportion of the total since December 2010...
To tie all these graphics together, we'll include a portion of the Mortgage Monitor table showing the monthly count of active home mortgage loans and their delinquency status, which comes from page 24 of the pdf.. The columns here show the total active mortgage loan count nationally for each month given, number of mortgages that were delinquent by more than 90 days but not yet in foreclosure, the monthly count of those mortgages that are in the foreclosure process (FC), the total non-current mortgages, including those that just missed one or two payments, and then the number of foreclosure starts for each month shown going back to January 2008. In the last two columns, we see the average length of time that those who have been more than 90 days delinquent have remained in their homes without foreclosure, and then the average number of days those in foreclosure have been stuck in that process because of the lengthy foreclosure pipelines. Notice that although the average length of delinquency for those who have been more than 90 days delinquent without foreclosure has fallen to 493 days, the average time for those who’ve been in foreclosure without a resolution has lengthened to a record average 1010 days.
(the above is from my weekly synopsis at MarketWatch 666)


Comments
still amazingly high
The foreclosure rates are still high and one would think they would drop to bubble years. Good God, you would think they would have run out of people to foreclose on by now.
90 days stil high
like the table right at the end of the post shows, there's still 1,143,222 homeowners who are more than 90 days delinquent but not yet in foreclosure (with an amazing average of 493 days behind on paying)..so there's still a lot of homeowners that are still in serious trouble, even though they have yet to be foreclosed on..
rjs
assets seized even after foreclosure
Amazing article from Reuters on how people are getting assets, accounts seized years after a foreclosure.
Good God, one would think losing the house, the secured asset, would be it. Article here.
not good
i have some friends who may be in that situation...
rjs