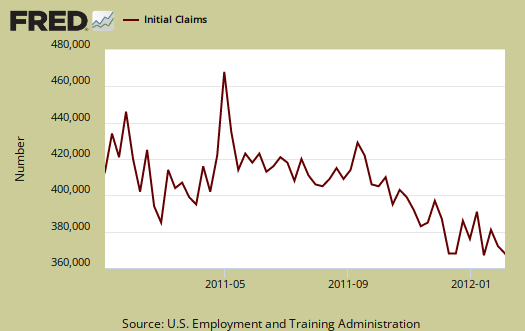
Initial weekly unemployment claims for the week ending on February 4, 2012 were 358,000. The DOL reports this as a decrease of 15,000 from last week. The previous week was revised, from 367,000 to 373,000, an increase of 6,000.

This is a sharp down tick. The DOL does adjust weekly initial unemployment claims for seasonal increases and decreases, but since the report is issued weekly, there is a lot of variance even with seasonal adjustments. January is a particularly nasty month for noise in seasonal adjustments.
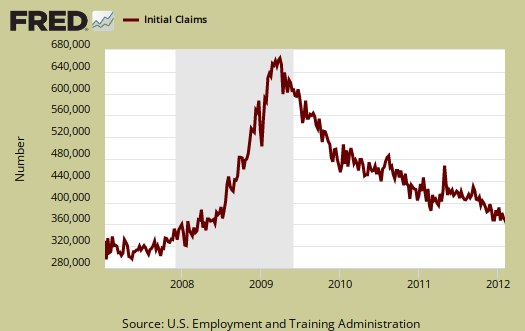
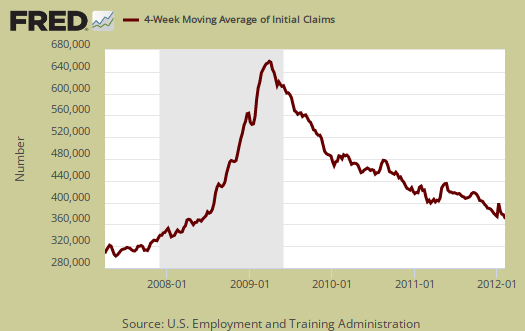
Every week initial unemployment claims are also revised and the above graphs shows this report is noisy. One simply cannot compare the reported numbers on a week to week basis due to the lag in States reporting claims data and revisions, plus the fact this is a 1 week time window, versus a monthly one. One needs to at minimum look at the 4-week moving average, which is also below the magic 400,000 number which shows jobs creation. The 4 week moving average is now 366,250 and decreased 11,000 from last week's 377,250 4 week average.
Below is the 4 week moving average, set to a logarithmic scale to remove even more statistical noise, for the last year. We have a clear downward trend, which is good news. The initial unemployment report is indicating moderate to modest job growth.

The magic number to show job creation is at minimum, below 400,000 initial unemployment claims, per week. Most Economists will quote 375,000 as the magic number to indicate job growth. Houston, we have a pattern, it seems finally, finally, weekly claims approaching that 375,000 level, as a trend, yet UI claims have not returned to pre-recession levels.
Below is the mathematical log of initial weekly unemployment claims, so one can get a better sense of the rise and fall of the numbers. A log helps remove some statistical noise, it's kind of an averaging. As we can see we have a step rise during the height of the recession, but then a leveling where every week initial unemployment insurance claims hover around 400,000, refusing to really drop for over two years, a never ending labor malaise for most of the time after the recession ended in July 2009. What we need to see here is a steep decline over time, which we seem to be finally seeing.

Below is the 4 week moving average, set to a log scale, from April 1st, 2007. Here we can see we still are not at pre-recession initial weekly unemployment claims levels. Clearly UI numbers have greatly improved from the above trend graph. Of course everyone in America should have been fired at least once by now.

Weekly initial unemployment claims are statistically noisy, the numbers are always revised, there is large variance because it's a weekly data report instead of monthly, and only through a long term pattern can one say anything about the unemployment situation. This report is great news, and what we want to see is a strong trend, dropping down to pre-recesion levels, where the labor market still wasn't so great.
Continuing unemployment claims dropped but bear in mind people can plain being running out of benefits.
The advance number for seasonally adjusted insured unemployment during the week ending January 28, was 3,515,000, an increase of 64,000 from the preceding week's revised level of 3,451,000. The 4-week moving average was 3,498,000, a decrease of 33,000 from the preceding week's revised average of 3,531,000.
In the week ending January 21st, not seasonally adjusted, the raw number was 7,663,205 official people obtaining some sort of unemployment insurance benefit. Officially, there are 12.758 million unemployed and if one takes all of the people who want a job, including those stuck in part-time because they can't get anything else, the number is over 28 million. Even at the January's job growth rate, it will take close to a decade to recover America's jobs.

Dems to propose unemployment benefits cuts
Just when you think workers might get a break we see this:
It's a compromise, but hello, anyone look at the long term unemployed graph recently? It has not dropped.
Thats Good Politics
Repubs know it. Six weeks of people dropping off the rolls makes continuing stats look better. Hah the Republicans actually want the unemployment rate higher so they will not push very hard here. This small 99 week act of charity and stimulus will remain intact. Two percent Social security taxcut too.
I'm excited about the first time claims! I'm scared about Israel unleashing a military strike on Iran and blowing up our recovery.
Lets Discuss This
Lets discuss job creation, not unemployment numbers -- without new jobs how is the unemployment numbers going down? The US hasn't recovered one jobs from the 9million lost from '07-'09, not one.
How is the unemployment rate doing down? Thanks the statisticians that work for the BLS and a election year.
not so
There has been job creation. Look to the left hand column and read the reports. There are new filings for unemployment. That means less people are losing their job, it's a different metric.
Also, I just went through a host of statistics and the BLS is simply a statistical agency, the issue is the confines of the surveys, funding for these branches and the Census.
There is plenty to be paranoid about but it just isn't these statistics. They are simply confusing to many is all by their nature. So are the BEA statistics.