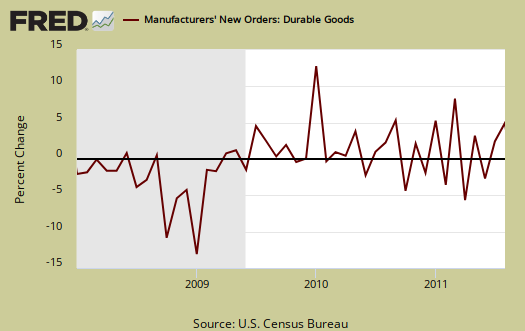
New Orders in Durable Goods decreased -0.1% for August 2011. New Orders has declined the last three months out of five. July durable goods new orders were revised from +4.0% to +4.1% increase.
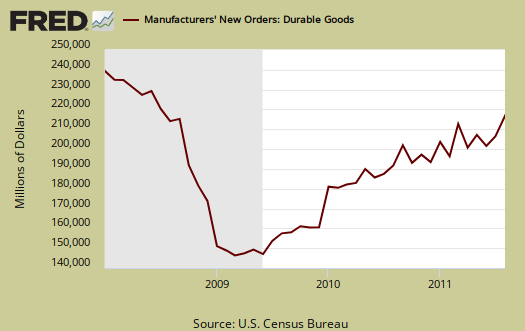
Most of the decrease was in primary metals, new orders down -0.8%. Motor vehicles new orders dropped -8.5% for August. Defense capital goods also dropped -5.7% in new orders. Computers popped up +5.5% and communications gear increased 7.8%.
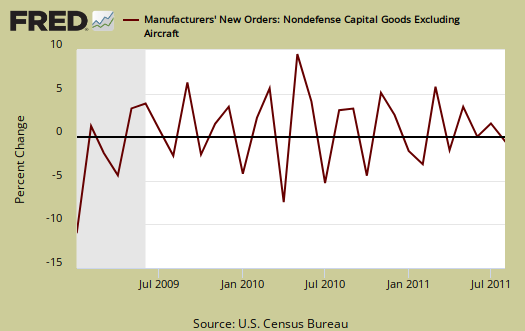
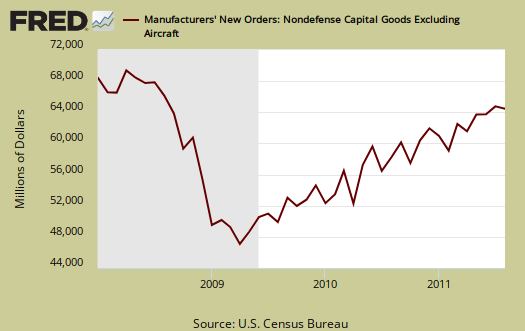
Core capital goods new orders increased +1.1%, after dropping -0.2% in July. July was revised significantly upward, originally reported as a -1.5% decline. Core capital goods is an investment gauge for the bet the private sector is placing on America's future economic growth.
For all transportation equipment, new orders flat lines -0.1%.
We now have two increases in new orders for the last four months, or 50-50 (sic). Seriously, this decline is more of a flat line, so the phrase it could have been worse about sums up this durable goods data report.
Core capital goods are a leading indicator of future economic growth. It's all of the stuff used to make other stuff, kind of an future investment in the business meter. Core capital goods excludes defense and all aircraft. Shipments in core capital goods increased +2.8% and July core capital goods shipments were revised to +0.4%. Machinery is a large part of core capital goods and new orders in machinery for the last three months are +0.1%, +1.9% and -1.4% for August, July, June, respectively. Core capital goods are back to 2007, or pre-recession levels. That said, this report is not adjusted for inflation.
It's typical for aircraft to vary dramatically, after all who orders up a billion dollar air-o-plane every day? This report is often dramatically revised as well.
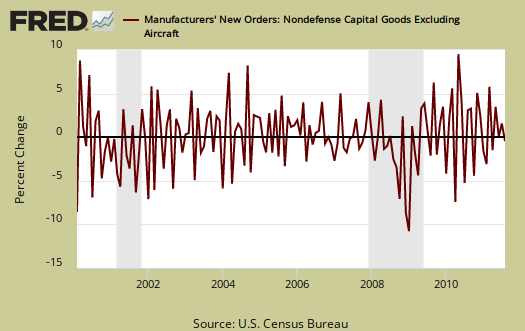
To put the monthly percentage change in perspective, below is the graph of core capital goods, monthly percentage change going back to 2000. In January 2009, core capital goods new orders dropped -9.9% and also declined by -9.4% in December 2008.
Inventories, which also contributes to GDP, are at an all time high and up 0.9%. Five months now inventories have hit record highs since inventories have been tracked via the NAICS system. Core Capital Goods inventories increased +0.8%.
Unfilled orders increased +0.9% with aircraft & parts, defense and nondefense, having unfilled orders at +1.7%.
Shipments, which contributes to the investment component of GDP, is down -0.2% for August with July revised to +2.1%. In August, motor vehicles and parts shipments decreased -8.5% and machinery increased +5.5%.
In core capital goods, shipments increased +2.8% for August, after a +0.4% July increase. June's revision is now +2.0% from +1.0% and is much better news as an approximation and indicator on Q2 2011 GDP growth. August's numbers are great news for Q3 2011 GDP as well.
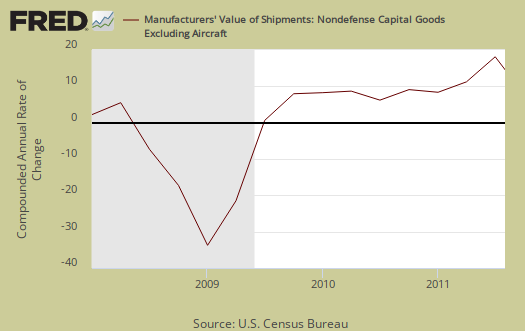
Q2 GDP 3rd revision is released tomorrow. The graph below is core capital goods shipments, quarterly annualized percent change. Today's durable goods report holds much better news for the Q2 GDP third revision (although trade assuredly will drag it down!).
Memory help: Q2 is April, May & June. Q3 is July, August & September.
Producer's Durable Equipment (PDE) is part of the GDP investment metric, the I in GDP or nonresidential fixed investment. It is not all, but part of the total investment categories for GDP, usually contributing about 50% to the total investment metric (except recently where inventories have been the dominant factor).
Producer's Durable Equipment (PDE) is about 75%, or 3/4th of the durable goods core capital goods shipments, used as an approximation.
What is a durable good? It's stuff manufactured that's supposed to last at least 3 years. Yeah, right, electronics, laptops and cell phones.
Here is last month's overview of Durable Goods, numbers unrevised.

'Core capital goods' questions
"Core capital goods" ... is that from the point of view of the machine tools manufacturer (shipper) or from the point of view of the producer who is purchasing equipment-machinery (receiver)?
I ask that because I suppose the numbers are for USA, but are we talking about in-USA producers (sellers) of machinery or are we talking about in-USA purchasers of machinery? The in-USA purchasers of machinery are going to be ordering outside the USA as often as not, although they may go through in-USA suppliers.
I am supposing that it's from the point of view of the receivers, the producers of consumer products of all kinds. It doesn't matter where the latest 10,000 units/second ExCello machine was manufactured -- USA or Germany or Italy or Japan or Taiwan. What matters is that manufacturers are tooling up ... or are they just ordering to replace normal wear-and-tear?
Also, what about equipment that is purchased at auction or otherwise from businesses that have closed down or down-sized? Like used but serviceable logging equipment, portable saw mills, and so forth? I guess that's negligible gyppo enterprises, tending almost toward the underground economy ... so, you can't track everything!
As an aspect of inflation, we might appreciate it if FRED would break down data to consider specific exchange rates. It's difficult to make comparisons year over year since machinery models change ... and sometimes prices are unique quotes. Then there's the cost of shipping plus installation (or major maintenance-repair) ... but if we could track USD prices through online catalogs ... I think exchange rates would be a big factor.
BTW: ProphetWithoutProfit back in June cited NYT for better-late-than-never recognition that core capital goods may not indicate anything positive for relief of unemployment. Purchase of a new 10,000 cans/second Excello machine may be keeping people employed in Germany but what if it doesn't require any more employees to run that the old 5,000 cans/second machine?
So, the thinking has been that Core Capital Goods may not be such a great index of employment ... and therefore maybe not a great index of disposable income ... and therefore not such a great predictor of GDP after all, because the new 10,000 cans/second Excello may be running at 40% capacity a year or two years after installed -- since people can't afford to buy the canned products (or are buying products not produced or canned in USA).
Oh well, I guess I really am a 'neo-Fordist' at heart (borrowing term from a recent comment here at EP).
Durable Goods, M3
The top link in these report overviews always goes to the government statistical site with more information.
It's usually linked in the first sentence. The data is manufacturers in the U.S. from a survey, most with $500 million or more in annual sales.
Inflation, or "real" is done by the BEA and that is where exports, imports are subtracted as well as "price deflators", i.e. exchange rates are part of that.
Then, all of that is translated into the BEA NIPA reports, and GDP is revised tomorrow so I will assuredly overview it.
This data, run by the Census (they always say the U.S. dept. of Commerce, but the actual statistical group is part of the Census) and this raw data is an input into the NIPA accounts, where the BEA takes over and gives you "real" or adjusted for inflation, data.
The MXP or price multipliers is where I've had a lot of problems cranking the numbers here to match the BEA. One of those things I haven't gotten to yet on what assumptions, data, etc. I'm missing.
FRED, again, is simply a data and graphing online tool, run by the St. Louis Fed research division. They don't tabulate any of these national statistics, but they offer tools to economists, researchers and students to help them with their analysis.
Durable goods is a component of GDP, PCE is the winner winner chicken dinner because PCE is 70% appox of GDP.
Thank you
Thanks for outline of data collection and analysis process.