This month's unemployment report is butt-ugly bad. The jobs situation has been dismal for 42 months or three and a half years.
Earlier we reviewed the June 2011 BLS unemployment report. As if only 18,000 jobs was not bad enough, both May and April new jobs numbers were revised downward, with May being as bad as this month now.
The change in total nonfarm payroll employment for April was revised from +232,000 to +217,000, and the change for May was revised from +54,000 to +25,000.
Let's drill down deeper into the numbers to show just how badly America needs good jobs.
There are 14,087,000 people officially unemployed, and if one takes the alternative measure of unemployment, it's 24.9 million.
Below is a graph, courtesy of the Saint Louis Federal Reserve, for the unemployment rate of just those unemployed 15 weeks or longer. 57.3% of the people who are officially counted as unemployed have been so 15 weeks or longer. The number of people unemployed 15 weeks or longer as part of the civilian labor force is 5.3%. Compare this to the official 9.2% unemployment rate. This means that it takes most people who are unemployed almost 4 months or more to find a job...if they do.

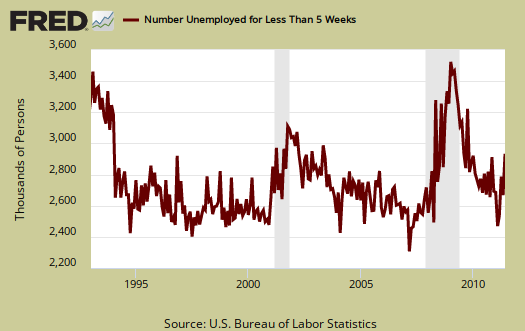
There are 3,076,000 people who are unemployed for less than 5 weeks in June, a increase of 412,000. People out of work 5 to 14 weeks increased 80,000 and 15 to 26 weeks unemployed declined -148,000. Below is the graph of those unemployed for less than 5 weeks.

The below graph is the median time for being unemployed over the last 20 years. Look at the pathetic dramatic increase over time. This month the median duration to be out of work increased 0.5 to 22.5 weeks. That means there is overall lost income by being out of work longer and we haven't even discussed how the new jobs are paying way less and most of the jobs being created are low paying jobs. The average time is even worse, 39.9 weeks. That's over 9 months as the average time to find a job. There is a vast deviation from the average and the median duration of unemployment. This means there are huge percentages of the unemployed who simply cannot get a break!

Most of the unemployed increase occurred with those unemployed less than 5 weeks. Great huh, while the country is supposed to be in recovery they fired an additional 412,000 people in June. Since March we have an additional 545,000 people officially unemployed. The long term unemployed increased by 89,000 people in June.
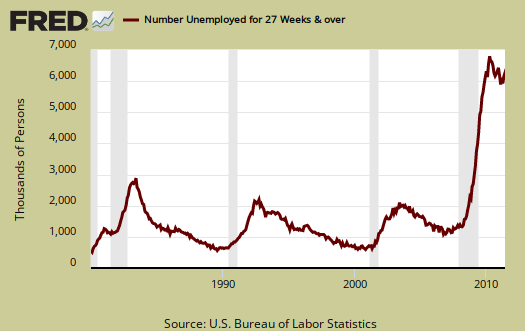
The problem with this number is we do not know the percentage of those who plain fell off the count and didn't get a job. We do know those being no longer counted as part of the labor force increase by 449,000 in one month. 44.4% of the official unemployed have been so for 27 weeks or longer. That's close to half of the official unemployed looking for work for over 6 months.
- Long term unemployed - 6.3 million
- Forced Part Time - 8.6 million
- Marginally attached to the labor force - 2.7 million
Of the Marginally attached, 982,000 are discouraged. Forced part-time decreased -52,000 this month, with those reporting the reason is slack business conditions increasing by 145,000. People who could only get part-time work increased 4,000, or no change, in June. The 2.68 million marginally attached are not counted in the official unemployment rate, but you can be guaranteed they do need a job. The BLS reports 6,537,000 people who are not counted in the labor force, actually want a job. That's huge.

U6, defined as total unemployed, plus all persons marginally attached to the labor force, plus total employed part time for economic reasons, as a percent of the civilian labor force plus all persons marginally attached to the labor force, (table A.15), was 16.2%.
To even get back to pre-recession unemployment rate levels we need a good 424,000 jobs created each month. That's permanent jobs. Even if the U.S. created 400,000 permanent jobs each month, it would take over 17 months to recover the jobs lost since December 2007, the start of the great recession, or 6.97 million jobs. If one created 400,000 jobs per month, to get to the start of the great recession unemployment rate of 5%, or roughly 10.8 million jobs, it would take over 27 months, or over 2 years to recover. Below is the seasonally adjusted monthly change in the number of payroll jobs in the U.S. See a lot of over 400,000 monthly increases in the past decade?

In looking over table B1 we can get a little more detail on what kind of jobs were created (and lost) on the permanent jobs front. Goldman Sachs alone offshore outsourced 1000 jobs to Singapore this month.
- Financial: -15,000
- Information: 0
- Construction: -9,000
- Manufacturing: +6,000
- Durable: +15,000
- Mining & Logging: +7,000
- Health and Education: 0
- Education: -17,400
- Health: +17,400
- Leisure and Hospitality: +34,000
- Professional & Business Services: +12,000
- Temporary Help: -12,000
- Professional &technical services: +24,200
- Computer Systems, Design: +5,600
- Trade, Transportation, Utilities: +17,000
- Retail Trade: +5.200
- Government: -39,000
- Local Government: -17,000
Below you think computer jobs, technical jobs are roaring back, think again. Our government likes to count foreign guest workers in the job statistics. These are most often cheaper replacements, used to displace and labor arbitrage U.S. professionals. Of course the government refuses to differentiate between guest workers and U.S. citizens in occupational employment statistics as well as give an accurate tally of how many, or what type of guest worker are in the country at one time.
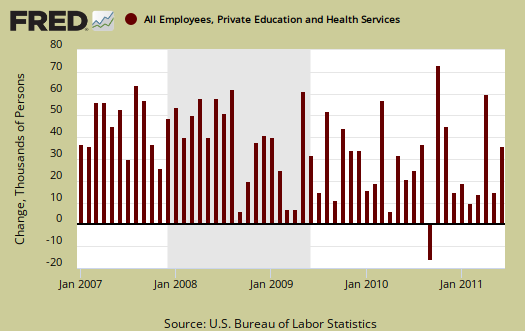
The fact health and education jobs have not grown this month is not a good sign. Teachers are clearly getting slaughtered.

While for some reason public or government workers are under assault, local government employees are clearly hurting. There has been 468,000 local government jobs lost since August 2008.
Below is the graph of the monthly change in manufacturing payroll jobs, seasonally adjusted, against the ISM Manufacturing Employment Index. Due to last month's -5k manufacturing jobs, growth in reality is flat. Amazing how well the ISM tracks the BLS actual manufacturing jobs by rate of change.

Bear in mind illegal workers and foreign guest workers are counted as employed Americans, which can distort occupational sectors, particularly the Engineering, I.T., Science and Technology ones. Below are the unemployment rates per occupational sector from table A-14, not seasonally adjusted.
- Financial: 6.8%
- Information: 7.9%
- Construction: 15.6%
- Manufacturing: 9.2%
- Transportation, Utilities: 8.2%
- Mining & Gas, Oil: 5.2%
- Health and Education: 5.8%
- Leisure and Hospitality: 10.9%
- Professional & Business Services: 9.1%
- Retail, Wholesale Trade: 9.7%
- "Other" Services: 8.7%
- Government: 5.8%
- Agricultural: 9.0%
- Self-employed, unpaid family: 5.7%
Probably the most horrific not seasonally adjusted unemployment rate is the 9.8% for Professional and Business Services unemployment rate. This occupation category implies a college degree. This particular area is fraught with foreign guest worker Visas, which distorts the real occupational unemployment rate. If an American is displaced by a foreign guest worker, then is forced to take a job at Walmart, that person is no longer categorized as a Chemical Engineering PhD out of work, but instead as a retail trade worker. So bear in mind all of these high occupational unemployment rates will miss people who took a lower paying job at Target in their statistics.
The above numbers are not seasonally adjusted so part of the agricultural and construction rates are due to the seasons, that said, construction unemployment has been decimated anyway you look at it. If one notices, the government unemployment rate is starting to tick up.
Leisure & hospitality are low paying, crappy jobs. These crappy jobs have increased 279,000 since January 2010.
The average work week decreased 0.1 to 34.3 hours, yet manufacturing average hours decreased 0.3 to 40.3 hours, an ominous sign. Average earnings for the private sector (drum roll please), decreased 1¢, $22.99/hr. The worker bees, or non-supervisory jobs average pay decreased 1¢ to $19.41/hr. Declining or flat wages is not a good sign. While inflation increases, wages are flat.
Take a look at how many industry sections are below full time hours. Is a common practice among employers to keep workers part-time, in order to deny them full-time benefits. These numbers have improved to more full time per industry.

You probably also want to know the birth/death model. What is that? It's a statistical adjustment to compensate for new businesses and dead businesses who are not actually tallied by data reports. Those jobs created and died outside the statistical reporting time window due to lag. So, the BLS estimates how many jobs can be attributed to those firms which are not actually counted. This month's adjustment was 131,000 jobs. One cannot directly subtract the birth/deal model monthly numbers, because unemployment data is seasonally adjusted, yet the birth/death adjustment is not seasonally adjusted, get that? Anywho, jobs attributed to new and dead businesses are just an estimate in so many words. Not seasonally adjusted, payrolls added 376,000 jobs. This is the reason why one cannot apply the birth/death model to seasonally adjusted data. Ok? You cannot mix them. If you want to take off the birth/death model you must do it to not seasonally adjusted data and then run the statistical algorithm to obtain the seasonally adjusted result.

HMG! Bonddad joins the “doom and gloomers”
Now I’m really scared! Is there such a thing as an economic bomb shelter? I want one!
The Bonddad blog which has made has been ‘mocking’ (literally) the so called “doom and gloomers’ (i.e. those who see the economy from the material conditions of the working class as opposed to charts and graphs of selective anecdotal corporate/political data) is starting to see what we have been talking about for two years. See “Where Will Growth Come From in the Second Half?” and “Employment Report: Sucks Wind”.
LOL, what a surprise
the direct attacks on so many I really stopped paying attention.
Now is the time to attack Congress and this administration. Case in point claiming those bad trade agreements are going to create jobs. What hog wash! Which I will write up soon.
Hey, just yesterday they were all saying things were good due to the ADP report. Wall Street really wants to put blinders onto the real economy and esp. Americans.
I gave up reading Bondad
It wasn't that he and New Deal Democrat were perpetually bullish - they are entitled to their opinion and they could have been right - it was, as you said, that they mocked anybody who didn't view this as a traditional recovery. They are still not on board completely, however. Hale Stewart is calling for a tax holiday for the big corporations that have tax-exempted their way to record profits, and now want to "repatriate" their tax-free earnings back to the US. Disgusting. They don't see these tax cheats as part of the problem.
you've got to be kidding me
There is so much analysis out there which shows the previous tax holiday did nothing for jobs, the U.S. economy. I know I overviewed one here.
NDD used to write here but (not I) another writer really got into it with him over "green shoots" and we had "call out wars". I'm not into that at all but assuredly the "green shoots" is now laughable. Mired in mud at best.
But I think this latest unemployment report will hopefully bring it home that we had corporate corrupt disaster in our politics and it's destroying the U.S.A.
DIRE is right
What does it take for "the elect" to understand what an emergency looks like?
It is clear that the plan is to just let this happen, roll on forever. I wonder where The Money Party boys think all of those people will go? Maybe that's the next step - off-shoring people. Remember Katrina? Use a disaster as the opportunity to move 200,000 people elsewhere, take away their vote, and make it nearly impossible for them to return home.
Dire is exactly right.
Michael Collins