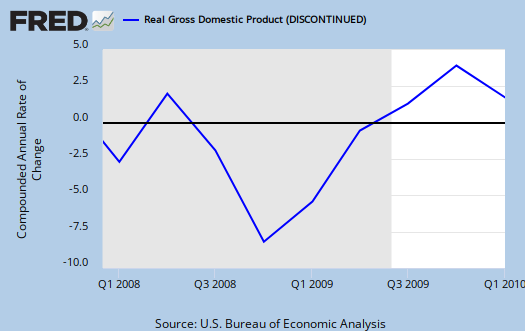
A 2nd estimate of Q1 2010 GDP was released Friday and the advanced report is 3.0%. Here is the Q1 2010 advance GDP estimate, where GDP was reported 3.2%. From the 2nd revision report, consumer spending (PCE) dropped from it's initial estimate and the trade deficit widened.

As a reminder, GDP is made up of:
where
Y=GDP, C=Consumption, I=Investment, G=Government Spending, (X-M)=Net Exports, X=Exports, M=Imports.
So, what changed? Here are Q1 2010, 2nd estimate breakdown of GDP percentage:
- C = +2.42
- I = +1.66
- G = -0.40
- X = +0.82
- M = -1.48
In the first revision for Q1 20910, those numbers, which make up the total GDP percentage growth were:
- C = +2.55
- I = +1.67
- G = -0.37
- X = +0.66
- M = -1.28
Below is the change between the Q1 advance and Q1 2010 2nd revision:
- C = -0.13
- I = -0.01
- G = -0.03
- X = +0.16
- M = -0.20
From the report:
The increase in real GDP in the first quarter primarily reflected positive contributions from personal consumption expenditures (PCE), private inventory investment, exports, and nonresidential fixed investment that were partly offset by negative contributions from state and local government spending and residential fixed investment. Imports, which are a subtraction in the calculation of GDP, increased.
The deceleration in real GDP in the first quarter primarily reflected decelerations in private inventory investment and in exports, a downturn in residential fixed investment, a larger decrease in state and local government spending, and a deceleration in nonresidential fixed investment that were partly offset by an acceleration in PCE and a deceleration in imports.
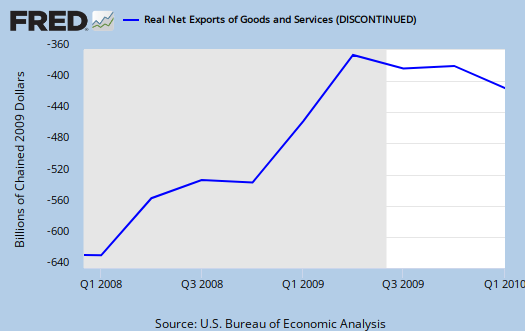
The trade deficit widened to -0.66% of the percentage contribution of GDP from -0.62%.
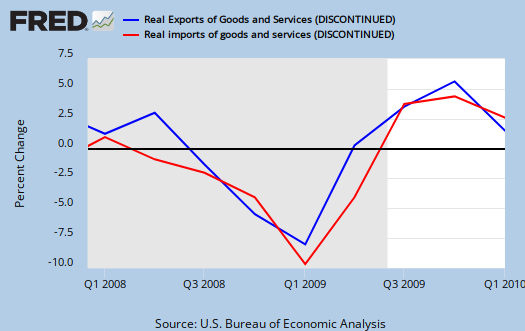
Real exports of goods and services increased 7.2 percent in the first quarter, compared with an increase of 22.8 percent in the fourth. Real imports of goods and services increased 10.4 percent, compared with an increase of 15.8 percent.

The below graph is the change, quarterly, of real imports vs. exports. As we can see, there is a sudden drop in U.S. exports that goes against the grain of recovery.

As in the advance report, C, or consumption (PCE), which reflects demand, dropped from the initial estimate but is still a driving force of positive GDP growth.
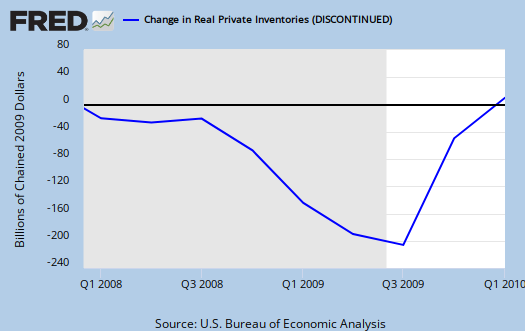
A main change was in investments again, attributable to changes in private inventories. Fixed non-residential investment also was only 0.01 of the total 3.0% GDP, revised from a meager 0.10. Residential investment was a -0.28. The changes in inventories accounted for 1.65 of GDP, up from in 1.57 in the first estimate. This is now over half, or 55% of GDP growth for Q1 2010!

One detail was fairly shocking, economic growth was in part due to cars. Below are some contribution points in real Q1 2010 GDP:
- Motor Vehicles: +0.49%
- Computers: +0.18%
- Structures: -1.18%
Structures are office buildings, investment in consumer places, hotels and so on.
Fixed private investment only rose 3.1% from last quarter and structures, down -15.3% from Q4, were the reason.
Personal savings was revised to 3.4% of personal income, originally reported as 3.1%.
Corporate profits were down from last quarter, as are funds. But this is net, with taxes collected increasing.
Profits from current production (corporate profits with inventory valuation and capital consumption adjustments) increased $81.4 billion in the first quarter, compared with an increase of $108.7 billion in the fourth quarter. Current-production cash flow (net cash flow with inventory valuation adjustment) -- the internal funds available to corporations for investment -- increased $30.8 billion in the first quarter, compared with an increase of $69.1 billion in the fourth.
The Banksters profits were:
Domestic profits of financial corporations increased $7.4 billion in the first quarter, compared with an increase of $65.0 billion in the fourth quarter.

GDP by industry
It looks like the BEA might start releasing some alternative measures of GDP. Their paper is here on it. They want to release GDP by industry, quarterly, by 2011 and it's mentioned they need some budget funds to do it. I read over this paper and it looks like a very good idea, esp. the GDP by income is something I should try to write up actually.
But the point is they note the lag time in currency information on GDP by industry. It would have been a 4 month delay instead of over a year to figure out which industries were in the tank, earlier, this recession, which implies policy makers (if we had some!) could act on that data sooner.
I hope they do it. If only we could get better statistics on U.S. labor markets/unemployment.