Robert already covered the ADP payrolls report, which has a strong correlation with the data from the BLS establishment survey, aka the Current Employment Statistics. In lieu of the missing household survey from the this month’s job report, we'll instead take a look at a few of the employment metrics produced from Gallup polling data. Gallup tracks the number of adults 18 and older who are employed, unemployed, and underemployed with a survey of 30,000 households monthly, in contrast to the survey of about 60,000 eligible households conducted by Census for the Labor Department. Gallup's survey is conducted daily over the month and also generates a daily unemployment rate from a 30 day moving average of responses, whereas the BLS household survey is conducted each month during the week of the 12th to generate the data for that entire month. Since the margin of error on the unemployment rate from BLS is plus or minus 0.2%, we'd have to figure Gallup's smaller survey has at least that much variability. Also note that BLS includes all those 16 and over in their household survey metrics...
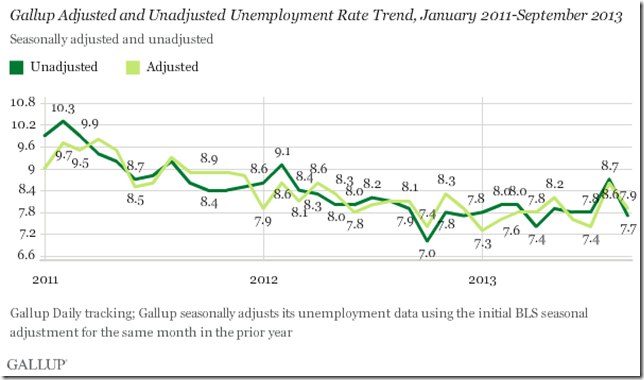
In computing an unemployment rate, Gallup figures the percentage of the workforce that are unemployed over a given month, with the "workforce" definition similar to the BLS's "labor force", ie, those adults who are working or actively looking for work and available for employment at the time they're surveyed. As collected and originally reported, Gallup's unemployment rate is not seasonally adjusted; thus their unemployment metric shows quite a bit volatility due to seasonal factors. Gallup's unadjusted unemployment rate fell to 7.7% in September, after hitting a 18 month high at 8.7% in August, so it's now back near the same levels they saw in June and July and the lowest it's been since April. They also generate a seasonally adjusted unemployment rate using a rather unsophisticated method; they apply the percentage seasonal adjustment as computed in the previous year's BLS adjustment for that same month to this year's data. So, since last year's September BLS report adjusted that month’s unemployment rate upward by 0.2%, they applied that change to this years data to generate a seasonally adjusted unemployment rate for September of 7.9%, down from the 8.6% rate in August, seasonally adjusted by the same method. The graph below from Gallup shows their unadjusted monthly unemployment rate from the beginning of 2011 in dark green, with an overlay of their seasonally adjusted unemployment rate computed by that method in light green; it's obvious that both are fairly volatile, some of which might be due to the smaller sampling than the BLS uses. But it does look like the unemployment rate in both metrics has been stuck in the same range over the past year and a half.
Gallup also generates an underemployment rate, without seasonal adjustment. This would correspond to the Labor Department's U-6 unemployment metric, where those who want full time work but are working part time for economic reasons, ie, either their hours were cut or they could only find part time work, are included in this broadest measure of unemployment. In September, Gallup found that 9.4% of us were just working part time, but wanted a full time job; that was up from 8.7% ‘involuntary’ part time workers in August, but down from 9.5% in July. Adding those who are working part time who want full time work to those unemployed works out to an underemployment rate of 17.1% in September, down from 17.4% in August, but up from 16.5% in September 2012. In contrast, the underemployment rate from the BLS was at a new low of 13.7% in August, down from 14.7% a year earlier. The Gallup graph below shows their monthly underemployment rate since the beginning of 2011; you'll note they're at their low for this year too, as February, April and May all registered part time for economic reasons rates at 10.1% However, they also showed somewhat lower underemployment rates for several months last year..
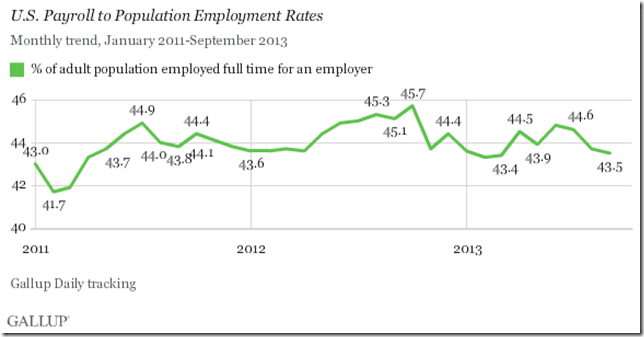
The last Gallup metric we'll look at is the payroll to population rate, or the percentage of the population 18 and older who are working full time (over 30 hours a week). This is similar to the employment-population ratio from the BLS, except that the BLS includes the self employed, part time workers and all those over 16 in their metric. Gallup found that their "payroll to population employment rate" decreased to 43.5% in September, down from 43.7% in August, and that it was 1.6 percentage points less than the 45.1% employment rate in September of last year. That means Gallup finds that the percentage of us working full time now is 3.5% lower than it was a year ago. This is again in contrast to the BLS employment-population ratio, which was at 58.6 percent in August, near where it had been most of the year and up fractionally from 58.4% a year earlier. Assuming a reasonable accuracy in both metrics suggests that a significant percentage of the population has been shifted from full time to part time work over the past year, something we've noted in covering the household survey earlier this year. For a visualization of that, the graph below from Gallup shows their payroll to population employment rate since the beginning of 2011. Although it's not included in the graph, Gallup notes that this metric is still at the same level as it was at in September 2010, meaning there has been essentially no growth in full-time employment in three years.
(crossposted from MarketWatch 666)


Comments
did something similar but there are labor flows
I think the answer must be with labor flows and duration of employment. On net, we're seeing 2 million jobs added per year, but that's barely enough to keep up with population growth. If duration of a job is short and these days employers fire people willy nilly, I think I read the tenure in Silicon valley was less than 8 months! That's a net job problem.
I did a calculation direct from the data and new jobs were mainly full-time, not part-time, see here, although part-time has dramatically increased as noted.
JOLTS shows about 2 million and the latest Census for 2012 saw no job growth at all in full time for women for the year.
methodology
my thought was that there must be a significant difference in the way the census interviews those chosen for the CPS and the questions asked by Gallup when theyre polling for the same data...it would be interesting to see what the differences are, and that if someone who is not considered employed by Gallup would in some way be considered employed in the household survey..another question is how are the sample popuations for each survey chosen...is there a bias in the CPS methods that selects more employed, or is the bias with Gallup's methods?
rjs
margin of error as well
Also window, 2010 is still a bad year for jobs and one can play a lot of games based on the time window.
People stuck in part-time jobs for economic reasons has clearly ballooned and is really staying up there in levels, which both say at least.