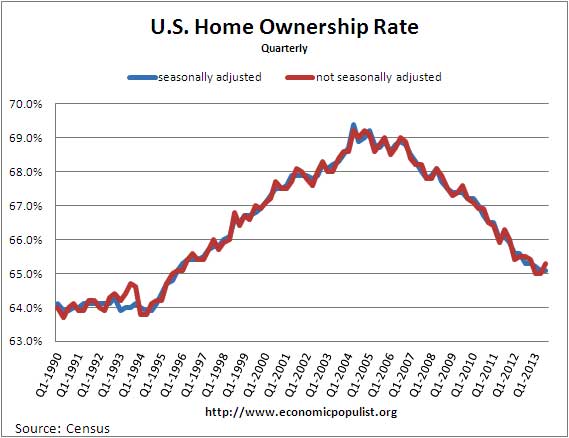
Home ownership is at the lowest rate since the 4th quarter of 1995. The Census released their quarterly housing vacancies and home ownership report. The seasonally adjusted homeownership rate is 65.1%. Many in the press tried to claim homeownership is increasing by quoting the not seasonally adjusted home ownership rate of 65.3%, which gives an uptick in people owning homes in America from the 2nd quarter of 2013. The reality is, not so. The great ownership society went bankrupt.
Below is a graph of home ownership rates, both seasonally and not seasonally adjusted, from 1990. Seasonally adjustments remove variance which comes from the different seasons in the year. For example, most people might own homes in the winter due to the summer buying season being a point of transition. That Q3 uptick from Q2 the press is so quick to jump on is within the margin of error and also due to seasonal variance. The 65.3% figure is not seasonally adjusted whereas the 65.1% figure is and shows a low point in home ownership for Q3 2013. Sorry, less people in America own homes than way back when to 1995.

From a year ago home ownership has declined by 0.3%. We don't know who is buying up all of the houses as of late but clearly the owners are not living in them, else the homeownership rate would increase.
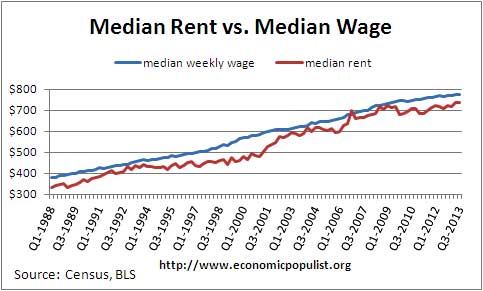
The rent situation isn't much better. The median rent increased to $736. That said, certain areas of the country are simply unaffordable, even if one makes six figures. For example, in Silcon valley, Santa Clara county, the average rent for a cruddy 1 bedroom is $2,128.
Below is a graph of the national median weekly wage graphed against the national median rent. One should spend no more than 25% of one's earnings on rent. While this appears to be maintained, on the median, we can see renters are not getting a break in housing costs to save their souls. From a year ago, the median rent increased by 4.35%. Median rent is at it's highest value ever.

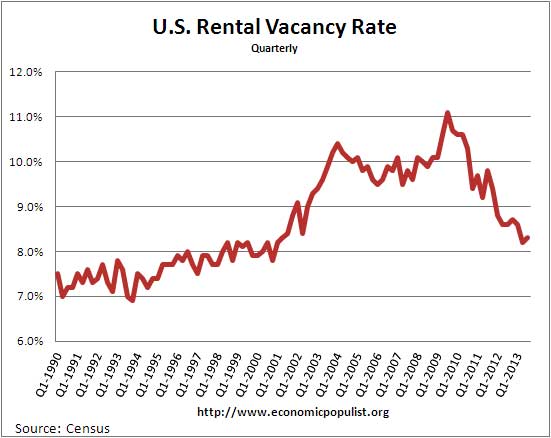
Rents might be also on the rise since the vacancy rate for rentals is declining. Graphed below is the not seasonally adjusted rental vacancy rate. From a year ago the vacancy rate for rentals dropped by 0.3 percentage points to 8.3%. Considering how flat wages really are, the below graph seems to imply an increasing demand for rental housing.

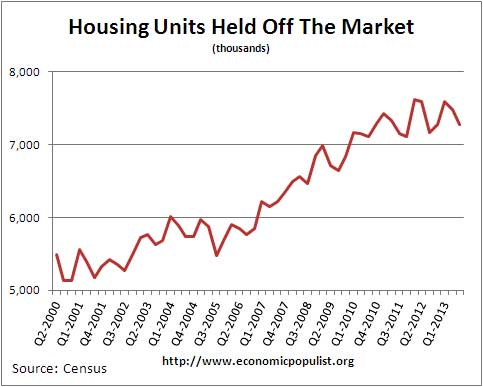
Another interesting factoid from the Housing Vacancy report is the number of vacant housing units kept off the market. While the housing supply grows due to increased population growth generally, notice the uptick of units held off the market starting around 2007 in comparison to the homeownership rate downward slide above.

Below is the report text on who is occupying the homes and the breakdown of those held off the market.
Approximately 86.4 percent of the housing units in the United States in the third quarter 2013 were occupied and 13.6 percent were vacant. Owner-occupied housing units made up 56.4 percent of total housing units, while renter-occupied units made up 30.0 percent of the inventory in the third quarter 2013. Vacant yearround units comprised 10.2 percent of total housing units, while 3.4 percent were for seasonal use. Approximately 2.8 percent of the total units were for rent, 1.1 percent were for sale only, and 0.9 percent were rented or sold but not yet occupied. Vacant units that were held off market comprised 5.5 percent of the total housing stock. Of these units, 1.8 percent were for occasional use, 0.9 percent were temporarily occupied by persons with usual residence elsewhere (URE), and 2.8 percent were vacant for a variety of other reasons.
Read it and weep folks, this report is not sudden good news that regular people can afford and buy a home again. If anything the statistics validate what most of America knows, the middle class is being exterminated.

sham
to even suggest that this is a "market" is ludicrous. It's a sham, the govt. bought all the toxic crap the banks sold during the bubble years, allowing the banks to survive (and prosper) and keep that huge backlog of homes off the market. Which BTW, if allowed to come on the market, maybe the huge number of walmart workers might be able to afford a home.
Makes me sick.
I won't call this report a "sham'
it's a survey, and it does validate what we suspect, the housing market is for investors and the rich, not regular people in many areas of the country, in particular California.
Sorry i wasn't referring to
Sorry i wasn't referring to the report or the post.
What i meant was that the post is another one of many which confirms to me that the housing market is totally manipulated in a way in that protects big money banks and hurts average working people who would otherwise be able to afford a home if the manipulation of the market was stopped.
housing market hype never went away
It is astounding with such a collapse the "forces" really want "business as usual", but this is one perspective in a series of data metrics which make me question who exactly is buying the homes. How can one possibly have a rebound when the main purpose of residential real estate should be to house the middle class.