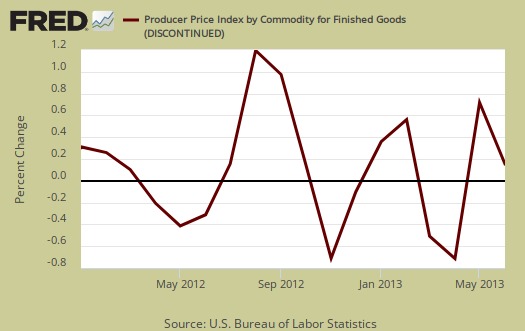
The June Producer Price Index increased 0.8% for finished goods. May PPI increased 0.5%, but April dropped -0.7%. For the year PPI increased 2.5%. This is the biggest annual increase since March 2012. Gasoline again is the culprit, with wholesale prices surging 7.2%. Core PPI, which is finished goods minus food and energy prices, increased 0.2% for the month. PPI is also known as wholesale inflation.
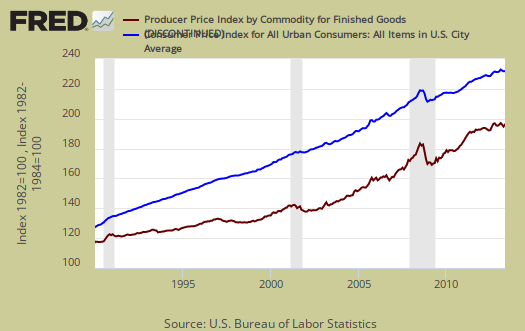
PPI often signals an increase in consumer prices down the road, although it is not a 100% guarantee. Often highly volatile wholesale price changes won't pop up as consumer prices changes due to the processing stages involved and other production factors. Below is a graph of PPI (maroon) vs. CPI (blue). Overall, PPI often is an indicator of what's coming down the road for consumer prices.
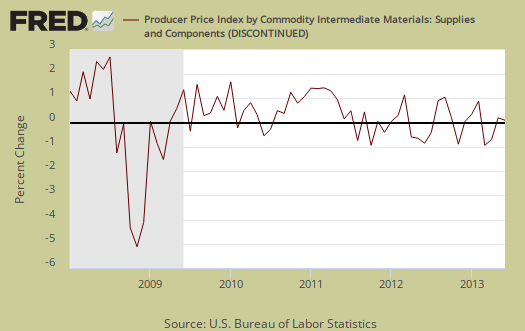
PPI is reported by stages of processing of materials, finished, intermediate and crude. Finished are commodities ready for final sale, intermediate are partially finished, such as lumber and cotton and crude are products entering the market for the first time, such as raw grain and crude oil.
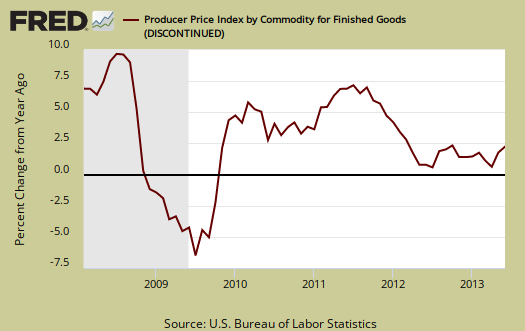
Unadjusted, finished goods have increased 2.5% for the last 12 months, the highest monthly increase since March 2012. Graphed below is wholesale finished goods PPI percent change for the year. While the highest annual increase since March 2012 sounds dramatic, as we can see from the historical graph, 2.5% isn't that bad.
The increase in food prices was due to meat, which surged 4.5% for the month. Pork lead the meat pack with a 6.3% increase. Fresh fruits and melons declined by -5.6%. A word on eggs. This month eggs declined -26.8%, but eggs are volatile and no surprise since one needs a willing Chicken first before an egg can be produced.

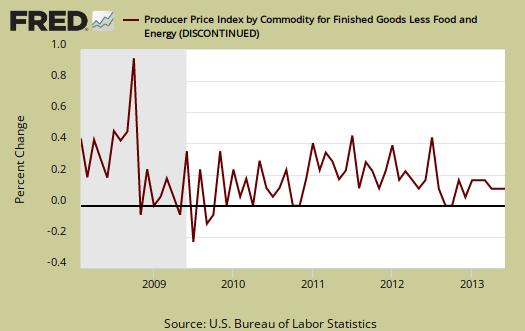
Core PPI, or finished goods minus food and energy, increased 0.2 from the previous month. This is the 8th month in a row core PPI has increased. Passenger cars increased 0.8%, but computers dropped -0.9% for the month.
Finished energy overall increased 2.9% for the month and was the largest increase since February's 3.2% jump. Below is the monthly percentage change of PPI finished energy only, to show the soaring prices. Residential gas had no change, electricity only increased 0.1%, home heating oil jumped up 6.1% and those never ending high wholesale gas prices increased 7.2%.

Products classified as crude are raw materials, entering the market for the 1st time and are the items which are further processed or go into other products. Crude PPI had no change for June. On a moving quarterly basis, we're breaking even as the last three months crude PPI has increased 1.7%, yet the previous three months crude prices declined -1.8%. Crude energy overall increased 0.3% for the month.

Crude foodstuffs declined -0.3% and on a moving quarter, crude food dropped -0.9% after declining -0.6% in the previous three months. Cows meant to be eaten dropped -3.8%.

Crude core increased 0.1% for the month on a nonferrous scrap 2.0% increase. For the last three months crude core has fallen -4.8%.
For intermediate wholesale goods we had a 0.5% increase, due to a 2.0% increase in intermediate energy wholesale prices. This month the increase was broad based, not just energy. Diesel increased 9.2% with intermediate energy overall increasing 4.3%. Intermediate core slightly increased by 0.1% due to a 1.1% jump in organic chemicals.
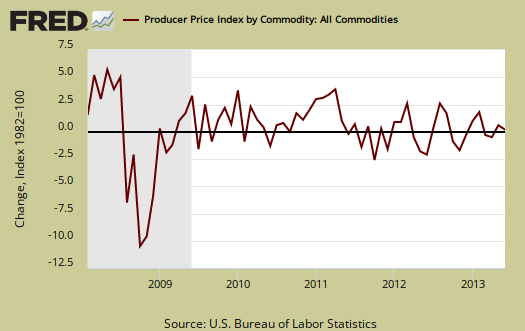
Below is the indexed price change for all commodities. Commodities are not limited to what comes from inside the United States. Here's the BLS definition of commodities by classification.
The commodity classification structure of the PPI organizes goods and services by similarity of material composition or end use, disregarding their industry of origin.
Commodities were supposed to soar due to the Fed's quantitative easing, yet seemingly due to the purchasing of MBSes, on commodities the effect has not been realized. Overall commodities increased 0.2% for June.
PPI also has special indexes which measure services and their margins. From the report it looks like prices just cut into profit margins:
Trade industries: The Producer Price Index for the net output of total trade industries moved down 0.5 percent in June following a 0.9-percent decrease a month earlier. (Trade indexes measure changes in margins received by wholesalers and retailers.) Leading the June decline, margins received by discount department stores fell 15.2 percent. Lower margins received by family clothing stores and merchant wholesalers of durable goods also contributed to the decrease in the total trade industries index.
Transportation and warehousing industries: The Producer Price Index for the net output of transportation and warehousing industries rose 0.6 percent in June after a 0.6-percent decrease in May. Most of the increase is attributable to a 3.0-percent jump in prices received by the industry for scheduled passenger air transportation. Higher prices received by the industries for long distance general freight trucking and freight transportation arrangement also were factors in the advance in the transportation and warehousing industries index.
Traditional service industries: The Producer Price Index for the net output of services less trade, transportation, and warehousing moved up 0.4 percent in June, the third consecutive increase. Accounting for about forty percent of the June advance, prices received by the industry group for depository credit intermediation rose 1.9 percent. Higher prices received by investment bankers and securities dealers and by the passenger car rental industry also contributed to the advance in the index for services less trade, transportation, and warehousing.
The Federal Reserves believes their core inflation target rate of 2.0% annual is safe and secure but real people, main street need to eat and drive their cars to work, so soaring energy and food prices do matter in the real world.
Here is the BLS website for more details on the Producer Price Index. They list individual items and special indexes.
Here are our past PPI overviews.

eggs
seems i read a month or two that eggs had spiked in price because a disease outbreak necessitated slaughering a significant part of the mexican flock, so this is likely just a return to normal prices..
rjs
they are volatile
I've watched eggs go up and down by 25% or more on a monthly basis for a long time.
Speaking of which, have you ever read what they do to animals we eat? It is horrifying.
I wish I was a vegetarian and what hens go through, well, free range all the way baby!
I really put in the eggs comment to see if anyone really reads these overviews? I often wonder how much depth I should cover for they take a long time! I see you are!