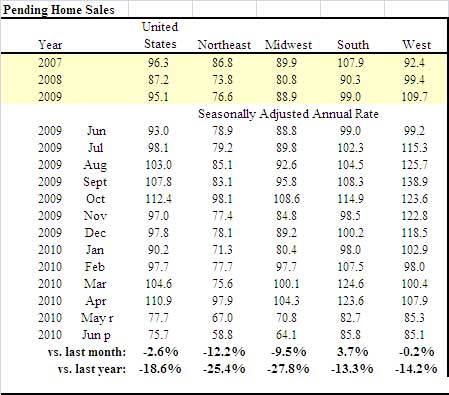
The NAR has released the Pending Home Sales Index, which dropped -2.6% from last month. The real story is the index is at record lows, to 75.7.
The Pending Home Sales Index,* a forward-looking indicator, declined 2.6 percent to 75.7 based on contracts signed in June from an upwardly revised level of 77.7 in May, and is 18.6 percent below June 2009 when it was 93.0. The data reflects contracts and not closings, which normally occur with a lag time of one or two months.
Below is the spreadsheet of the index.

AP reports this is the lowest number of pending sales since 2001.
While some will blame the ending of the home buyer's tax credit, look at these facts, in the Associated Press article:
Economists say the government incentives prompted many buyers who might have signed contracts during May and June to move their purchases up. That's one reason for the sharp decline.
But they also point to the growing inventory of unsold homes on the market. It has risen to almost 4 million. That's nearly a nine-month supply at the current sales pace, the highest level since August. It compares with a healthy level of about six months. And that doesn't include millions of foreclosed homes that have yet to go onto the market.
Many analysts believe the number of homes for sale or headed for foreclosure is so high that prices will slip this fall and hit the bottom by early next year.
So, we're looking at falling prices, which considering the death of the U.S. middle class, the ones who supposedly buy these houses, isn't surprising.
Calculated Risk has graphs and analysis of pending home sales.

Recent comments