
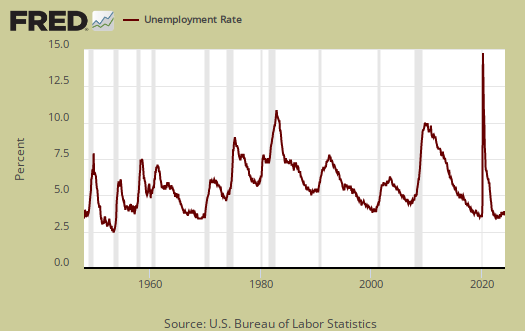
The August 2016 unemployment report shows a fairly underwhelming month of statistics, yet not as bad as some in the press would have you believe. The unemployment rate remained the same at 4.9%, the third month in a row. Generally speaking August was no change from July. Both the labor participation rate and the civilian to employment ratio did not change. The number of people employed was low and similar to the number of those unemployed. Generally speaking there was almost no movement in the month to month unemployment statistics, taking into account margins of error.
This article overviews and graphs the statistics from the Employment report Household Survey also known as CPS, or current population survey. The CPS survey tells us about people employed, not employed, looking for work and not counted at all. The household survey has large swings on a monthly basis as well as a large margin of sampling error. This part of the employment report is not about actual jobs gained but people and their labor status.
Those employed now stands at 151,614,000, a monthly increase of 97 thousand. From a year ago, the ranks of the employed has increased by 2.571 million. That's a reasonable annual gain even though the month is a paltry figure.

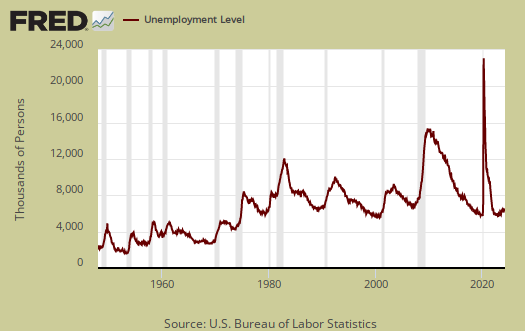
Those unemployed increased by 79 thousand for the month, almost a number reversal of those employed and statistically close as well. From a year ago the unemployed has decreased by -169,000. That the status quo, but there are still those no longer counted who are still in need of a job.
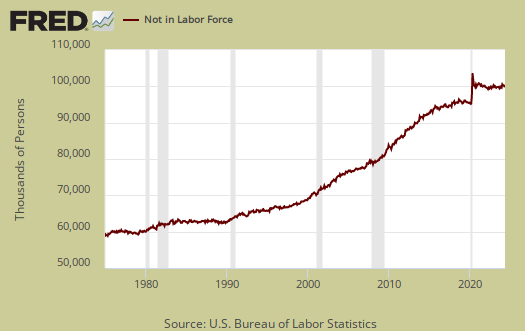
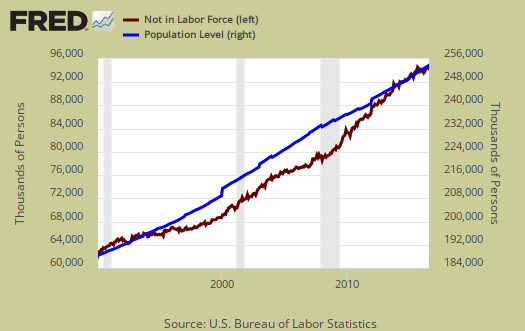
Those not in the labor force is 94,391 million. The below graph are the not in the labor force ranks. Those not in the labor force has increased by 356,000 in the past year and increased by 58 thousand for the month. It is people who need a job who have stopped trying to get one in addition to baby boomer retirees.
The labor participation rate is 62.8%. This is no change from last month. Pre-recession, the January 2008 labor participate rate was 66.2% a far cry from what we see today. Ignoring labor participation rates after 2008, one has to go to the late 1977 to find rates this low.

Below is a graph of the labor participation rate for those between the ages of 25 to 54. The rate is 81.3% and this is a 0.1 percentage point increase from last month, a good sign. These are the prime working years where people are not in retirement or in school full time commonly, so one should not see record low participation rates with a 4.9% unemployment rate. In January 2008 the prime working years labor participate rate was 83.3%.

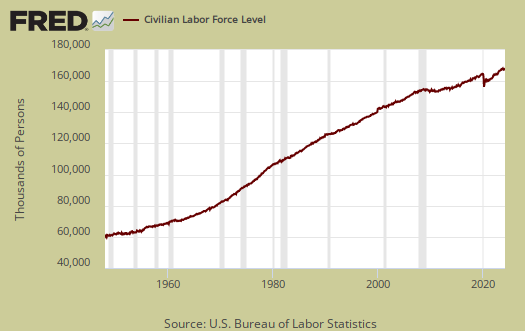
The civilian labor force, which consists of the employed and the officially unemployed, increased by 176,000 to stand at 159,463,000. The civilian labor force has grown by 2,402,000 over the past year. This is actually high annual growth, we hope it is not artificial growth since the BLS counts those on guest worker Visas and even illegal workers mixed in with permanent resident and citizen workers.
Below is a graph of those not in the labor force, (maroon, scale on the left), against the noninstitutional civilian population (blue, scale on the right). Notice how those not in the labor force crisscrosses the noninstitutional civilian population in growth. The civilian noninstituitonal population is from where all other labor statistics have sprung, so to see strong acceleration in those not counted as participating in the labor force than the pool of population possible to be part of the labor force in the first place has been the bad sign of the last eight years.
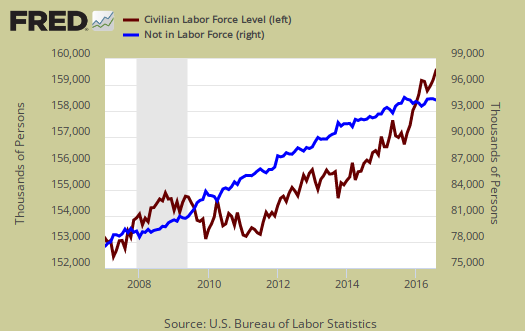
Below is a graph of the civilian labor force, or the official employed plus unemployed, in maroon, scale on left, against those not in the labor force, in blue, scale on right. See how those not in the labor force as a trend exceeded those considered employed and unemployed starting around mid 2009. Starting in 2014 it has reverted back, yet it oscillates starting in 2015. To have a solid employment situation those not in the labor force should be growing less than those obtaining jobs and being counted as looking for work. Those not in the labor force does include retirees and students and there is a baby bump with both of these segments of the population.
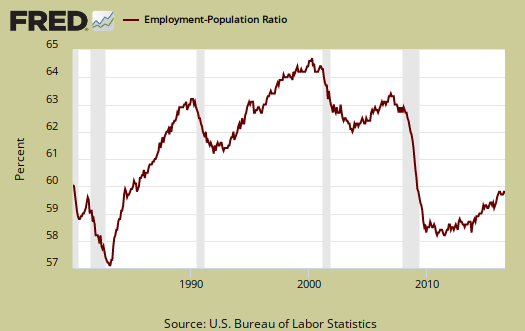
Those considered employed as a ratio to the total Civilian noninstitutional population now stands at 59.7%. This is no change from last month the level has not seen since 1985 (ignoring the financial crisis aftermath). In January 2008, this figure was 62.9%. We should also point out that the employment to population ratio and the labor participation rate have been oscillating also around record lows in what seems to be an infinity pattern (sic) and this month is no different. The relationship between the employment-population ratio and the labor participation rate (LPR) is: employment-population ratio = LPR * (1 - unemployment rate).
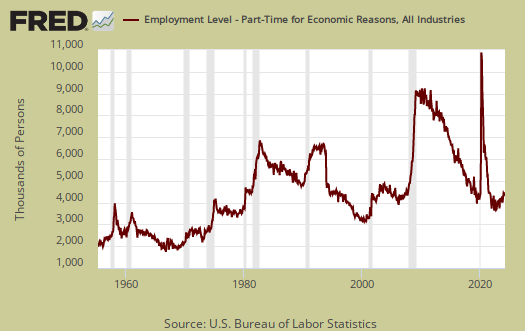
Then there are a slew of terrible jobs. and part time work gives us some hints as to the kind of work being procured. Those forced into part time work for economic reasons stands at 6,053,000 people. This is a change of 113,000 from last month. The annual decrease of -428 thousand a positive annual sign but a poor monthly one.
There are two categories of those forced into part-time jobs due to economic circumstances. Those who could only get part-time jobs and those already working who got their hours cut due to businesses not having enough work for them. The number of people who could only get part-time jobs stands at 1,929,000 as shown below. This is a monthly decline of -52 thousand for the month. A year ago, the number of those stuck in part-time jobs was 2,229,000, so an annual decline of -300,000.

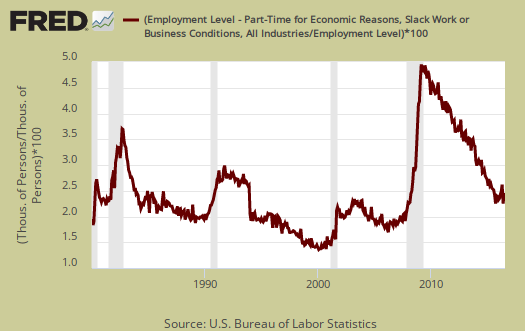
People can also work part-time hours due to slack business demand. People who got their hours cut due to slack working conditions stands at 3,727,000, a 85,000 increase from last month and the second month in a row for an increase. Below is a graph of forced into part-time work because they got their hours cut, as a percentage of the total employed. This is a recession economic indicator as weak economic demand forces businesses to reduce the working hours of employees.
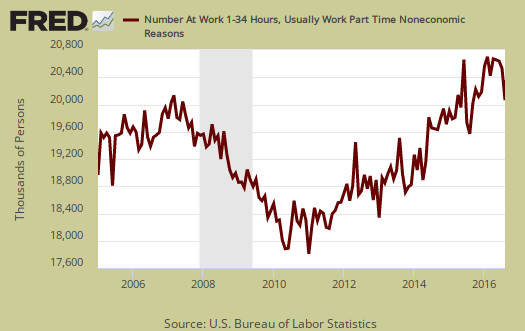
Part-time workers who are voluntarily working part-time jobs stands at 20,523,000, a monthly decrease of -194,000. From year ago those working part-time increased by 751,000.
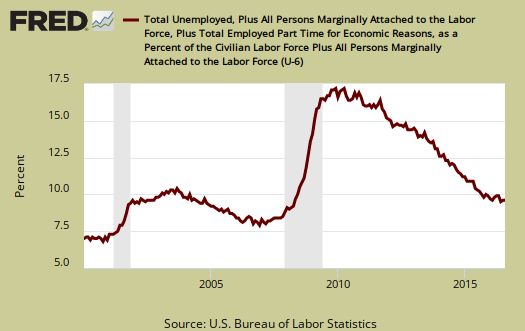
U-6 still stands at 9.7%, which is no change from last month. U-6 is a broader measure of unemployment and includes the official unemployed, people working part-time hours because that's all they can get and a subgroup not counted in the labor force but are available for work and looked in the last 12 months. The U-6 rate still leaves out some people wanting a job who are not considered part of the labor force, so while it is called an alternative rate, but it still ignores many who should be counted as unemployed.
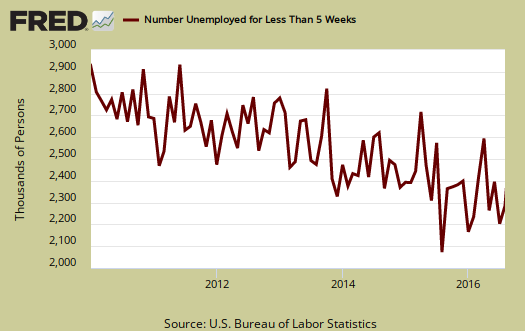
The newly unemployed stands at 2,290,000, a 130 thousand monthly increase. Statistically speaking, BLS CPS data series are independently calculated, but this negates any trend suggested from last month Below is a graph of those unemployed for less than five weeks.
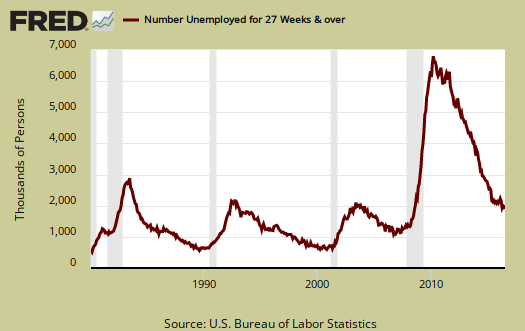
The long term unemployed, or those unemployed for 27 weeks and over, is 2,006,000 people. This is a -14 thousand monthly decrease. From a year ago the long term unemployed ranks has declined by -183,000.
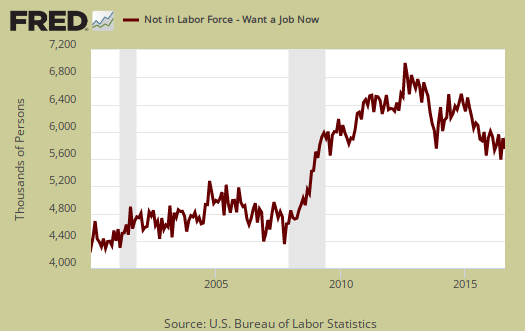
Within the CPS survey is how many people who are considered not in the labor force who report they want a job now. It is a direct survey question. The Census asks people who are not being counted in the unemployment statistics and official unemployment rate if they want a job. The number who answer yes currently stands at 5,883,000. Those not in the labor force who report they want a job declined by -85 thousand from a year ago. For the month those not considered part of the labor force who said they wanted a job declined by -53 thousand. Those who are not counted yet report they want a job includes the discouraged workers and marginally attached and is seasonally adjusted.
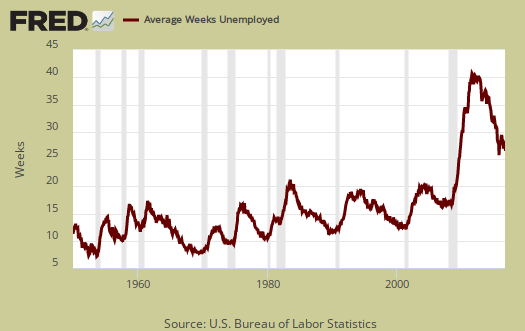
The average length of unemployment is 27.6 weeks, an decrease of 0.5 weeks from last month. The average time to be unemployed has stayed completely out of alignment with the median duration. A year ago the average duration of unemployment was 28.3 weeks.
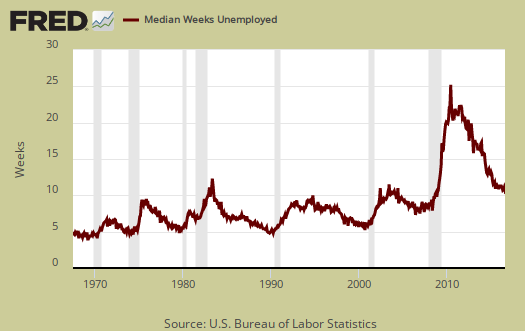
The median time one is unemployed, which means 50% of people have gotten a job in this amount of time is 11.2 weeks, a change of 0.4 weeks from last month. A year ago the median time to be unemployed was 12.1 weeks.
This month's CPS report by itself was amazingly static with almost no change from last month. That said, the CPS is notoriously volatile with 100,000 data size swings routine from month to month. Here are our past overviews CPS unemployment statistics, only graphs revised.
Recent comments