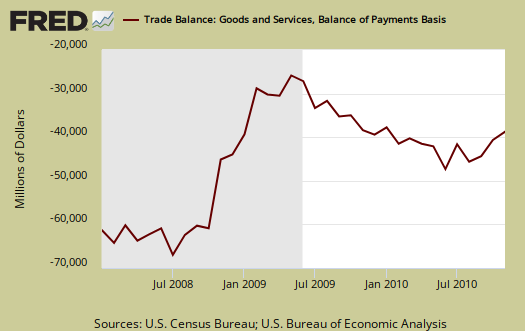
The November 2010 U.S. trade deficit decreased $0.1 billion to $38.3 billion. October's trade deficit was revised to $38.4 billion. Exports increased $1.2 billion and imports increased $1.1 billion. That's only a 0.7% increase in exports from last month, so in a nutshell, the trade deficit didn't budge much from October.

Imports were 1.24 times larger than exports for November, same as October. In other words, for every dollar we export, we import $1.24 worth of stuff.
The way the BEA reports the monthly year change is funky. The report states the deficit is up $3.0 billion, with exports are up 14.9% while imports have increased 13.6%. Bear in mind these yearly import and export percentage changes are just a month-by-month comparison of November 2009 to November 2010, it's not an aggregated yearly amount or average.
On a Balance of Payments basis, seasonally adjusted, so far this year the trade deficit, which includes services in addition to goods, is -$458,655 billion, a 35.7% increase in comparison to the same 11 months (January through November) of last year.
Below are imports vs. exports of goods and services from January 2007 to November 2010. Notice how much larger imports are than exports.

Below is the list of good export increases from October to November.
- Industrial supplies and materials: $0.3 billion
- Foods, feeds, and beverages: $0.59 billion
- Automotive vehicles, parts, and engines: -$0.56 billion
- Capital goods: $0.2 billion
- Cther goods: -$0.59 billion
- Consumer goods: $0.97 billion
In the exhibit 7 Census accounting method breakdown, for consumer goods, pharmaceutical preparations is the #1 export in that category. Capital goods exports the largest contributor aircraft. Cotton is #1 for industrial supplies and wheat had a great showing on foods exports.
Goods import changes:
- Industrial supplies and materials: $1.95 billion
- Capital goods: $0.98 billion
- Foods, feeds, and beverages: $0.16 billion
- Automotive vehicles, parts, and engines: -$0.43 billion
- Consumer goods: -$0.92 billion
- Cther goods: -$0.20 billion
The above are seasonally adjusted. Crude oil imports increased $1.92 billion for November.
On services, exports decreased $100 million while imports decreased $300 million.
Advanced technology products reverted back to a trade deficit in the monthly change. With China alone, we have a -$10.931 billion trade deficit in advanced technology products, on a Census accounting basis. All of these numbers appear to not be seasonally adjusted.
Advanced technology products exports were $23.1 billion in November and imports were $34.4 billion, resulting in a deficit of $11.2 billion. November exports were $0.6 billion less than the $23.7 billion in October, while November
imports were $2.2 billion more than the $32.2 billion in October.
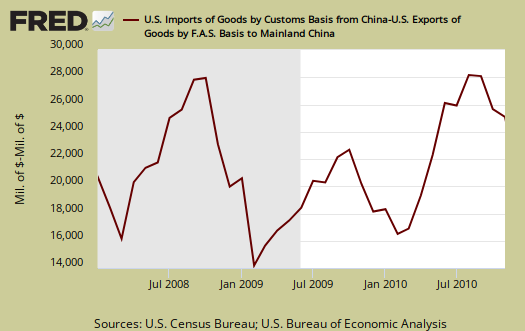
Here is the breakdown with major trading partners, not seasonally adjusted. China is the worst trade deficit, with $25.6 billion, $100 million more than last month.
Also astounding is the OPEC trade deficit (read oil imports), increased to $7.0 billion from $5.7 billion last month, making OPEC our third worse trading partner. The EU is second. Realize OPEC, which is oil, doesn't even compare to the trade deficit with China. The trade deficit with China is 3.66 times higher than OPEC, yet on the political front, the rhetoric goes we must get off of our addiction to foreign oil. How about America's addiction to Chinese goods?
The November figures show surpluses, in billions of dollars, with Hong Kong $1.9 ($1.9 for October), Australia $1.2 ($1.3), Singapore $0.5 ($0.6), and Egypt $0.4 ($0.5).
Deficits were recorded, in billions of dollars, with China $25.6 ($25.5), European Union $7.1 ($7.1), OPEC $7.0 ($5.7), Japan $5.8 ($5.7), Mexico $5.6 ($5.8), Germany $3.1 ($3.3), Ireland $2.3 ($2.7), Canada $1.8 ($1.2), Nigeria $1.7 ($1.8), Venezuela $1.6 ($1.2), Korea $1.6 ($1.1), and Taiwan $0.8 ($1.0).
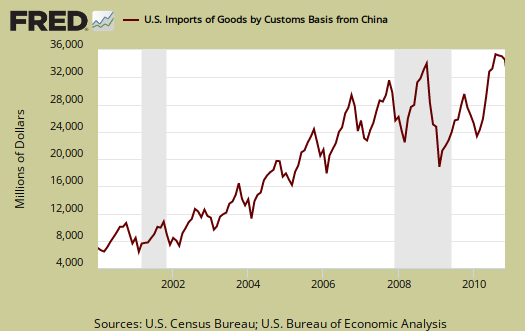
Below is the raw customs basis accounting of the trade deficit with China, not seasonally adjusted. China alone is 45.8% of the goods trade deficit and that goods deficit has grown 27.1% from a year ago. If one takes out crude oil, which only thousands of dollars are imports from China, China becomes a whopping 71.6% of the total trade deficit.

Below is a graph of China imports into the United States from 2000, to show just how much imports from China have grown. The visual is stunning, it looks like a rocket pointed directly at the U.S. economy.

On oil, or petroleum, the November deficit was -$12.0 billion, in 2005 chain weighted dollars, this is an uptick of $359 million.
October's trade deficit was revised to $38.4 billion from $38.7 billion. Here is October's report (unrevised). Here is the BEA website for additional U.S. trade data.
You might ask what are these Census Basis versus Balance of Payment mentioned all over the place? The above mentions various accounting methods so we're comparing Apples to Apples and not mixing the fruit. The trade report in particular is difficult due to the mixing of these two accounting methods and additionally some data is seasonally adjusted and others are not. One cannot compare values from different accounting methods and have that comparison be valid.
In a nutshell, the Balance of Payments accounting method is where they make a bunch of adjustments to not count imports and exports twice, the military moving stuff around or miss some additions such as freight charges. The Census basis is more plain raw data the U.S. customs people hand over which is just the stuff crosses the border. The 2005 chain weighted stuff means it was overall modified for a price increase/decrease adjustment in order to remove inflation and deflation time variance stuff.
Bottom line, you want just the raw data of what's coming into the country and going out, it's the Census basis and additionally the details are only reported in that accounting format.

Trade Deficit News Still Bad News
Here’s what is most important about the trade deficit news:
First, the U.S. trade deficit for 2010 is half a trillion dollars, a 34% increase over last year. That is bad news for American jobs.
Second, U.S. reliance on imported goods continues to rise. If we filled our demand for goods with American products, we would see more American jobs created. But instead we buy more and more imported items, so our unemployment situation never gets better.
If we want to see a real recovery, that includes actual jobs for Americans, we need to start buying American-made goods. We each need to make the effort to support the creation of American jobs with our everyday purchases. It really does make a difference.
Find out how you can buy American at http://buyamericanchallenge.wordpress.com/