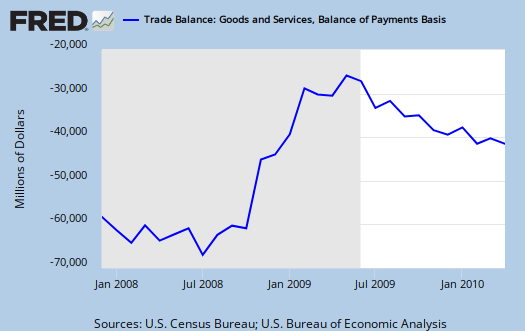
The April 2010 U.S. trade deficit increased $300 million billion from last month $40 billion (revised) to $40.3 billion. Both imports and exports decreased. Imports dropped -$800 million and exports were down a billion dollars.

The raw totals of exports are $148.8 billion with imports of $189.1 billion. Taking inflation into account, imports dropped -1.51% from last month with exports dropping -2.48%.
For the year:
The goods and services deficit increased $11.8 billion from April 2009 to April 2010. Exports were up $24.7 billion, or 19.9 percent, and imports were up $36.5 billion, or 23.9 percent.
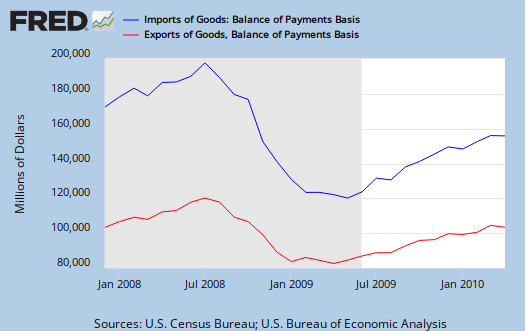
Goods make up the majority of trade and both exports and imports decreased in volume from the previous month.
In April, the goods deficit increased $0.1 billion from March to $52.5 billion, and the services surplus decreased $0.1 billion to $12.2 billion. Exports of goods decreased $1.1 billion to $104.0 billion, and imports of goods decreased $1.0 billion to $156.5 billion. Exports of services increased $0.1 billion to $44.8 billion, and imports of services increased $0.2 billion to $32.6 billion.
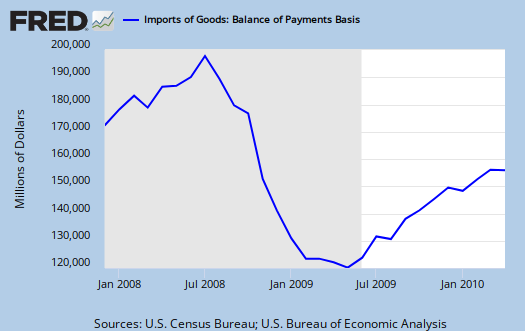
Below are imports vs. exports of goods from the official start of this recession. Notice the decrease in volume on both exports and imports in April.

A barrel of crude oil average costs were $77.13, resulting in a Cruel oil imports increase of 1.9% from last month in terms of real dollars.

The biggest decline in imports was consumer goods, a -4.4% decline from last month. Consumer goods exports were a -5.3% decrease from last month. The biggest increase in exports was industrial materials and supplies, a 1.8% increase. Below is the breakdown from the report:
The March to April decrease in exports of goods reflected decreases in other goods ($0.8 billion); consumer goods ($0.7 billion); and foods, feeds, and beverages ($0.6 billion). Increases occurred in industrial supplies and materials ($0.6 billion) and automotive vehicles, parts, and engines ($0.1 billion). Capital goods were virtually unchanged.
The March to April decrease in imports of goods reflected decreases in consumer goods ($1.7 billion); other goods ($0.5 billion); and automotive vehicles, parts, and engines ($0.2 billion). Increases occurred in capital goods ($1.4 billion) and
industrial supplies and materials ($0.1 billion). Foods, feeds, and beverages were virtually unchanged.The April 2009 to April 2010 increase in exports of goods reflected increases in industrial supplies and materials ($10.8 billion); capital goods ($4.9 billion); automotive vehicles, parts, and engines ($3.4 billion); consumer goods ($1.2 billion); other goods ($1.0 billion); and foods, feeds, and beverages ($0.3 billion).
If you are in denial about offshore outsourcing hurting the U.S. advanced technology sector, one might consider these numbers. Information and Communications has a growing deficit. Just this year alone and these numbers are only to April, the deficit is -$36.067 billion. For last year, the total year, the deficit was -26.072 billion. So, in a matter of 4 months, information and communications trade deficit has exceeded the entire last year.
Advanced technology products exports were $21.1 billion in April and imports were $26.9 billion, resulting in a deficit of $5.8 billion.
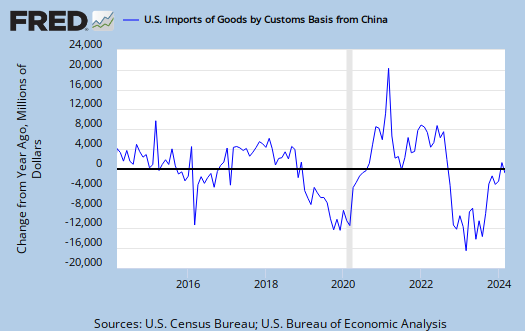
Below is the annual percent change of Chinese imports into the United States. China was 38% of the total trade deficit, including oil. OPEC (read oil) is our next worse trade deficit, at 18%. The trade deficit with China jumped 12.4% from last month.

With all of the talk on Europe's implosion, are you aware we run a trade deficit of -$5.7 billion, -$7.1 billion last month, with them? So much for high wages and social safety nets being this god awful thing.
Here is the Government website on Foreign Trade. Here is last months post on March's trade deficit, not revised.

Obama is claiming exports "increased"
Hello, this is some serious spin coming from the White House. Of course global trade increased by the "trough" of economic Armageddon but exports have actually decreased from the last report.
Ya all may blast paying attention to the actual numbers, graphs and raw reports but here is an example of a good reason to do so. You an quickly ascertain spin on economic claims.