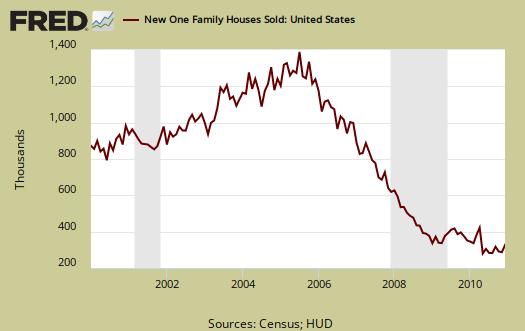
New Residential Single Family Home Sales increased 17.5% from November, with an annual sale rate of 329,000 new homes. This is in comparison to a seasonally adjusted revised annual rate of 280,000 new home sales for November. Sales for single family homes are still down -7.6% from this time a year ago.

The above graph shows, while this sounds like a great report, it's more new home sales are bouncing along a bottom. The supply of new homes is now at 6.9 months of inventory, which is a decline of significance from last months 8.4 months of supply reported.
For all new home sales, not just single family, the figures are more depressed. Sales are down -14.2% from a year ago to an annualized total of 321,000.
The median sales price of new houses sold in December 2010 was $241,500; the average sales price was $291,400.
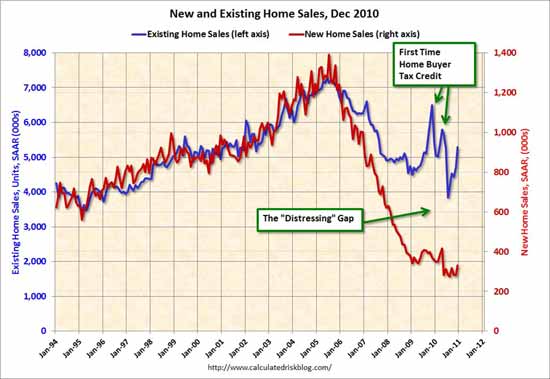
Calculated Risk creates a custom analysis on the divergence between new and existing home sales called the distressing gap and has more graphs on the real estate sector. This key graph shows the repression of new home sales by foreclosures, a glut of inventory, short sales and the like. Existing home sales incorporate the above and even so, there is a huge amount of inventory, or shadow inventory being kept off of the market.

CR's analysis helps explain why, when we get this great sounding report, in actuality S&P and others are pointing to a double-dip plunge in home prices.

Recent comments