
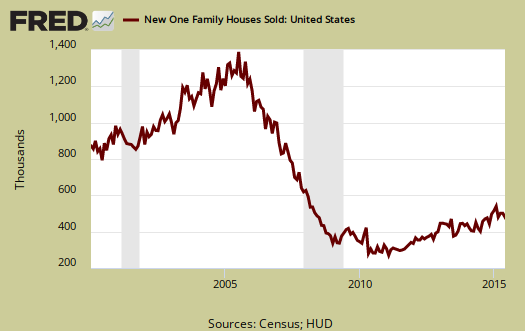
The June 2015 New Residential Single Family Home Sales plunged -6.8%. Sales dropped from 517,000 to 482,000 for the month. For the year, new single family home sales are up 18.1% from the year ago 408,000 sales levels. The annual increase is equal to the ±18.1% margin of error. What a difference a survey group makes as this report is from the Census while existing home sales is published by NAR. Of course one survey is for new homes while the other is for existing ones. In the Census survey, amounts are annualized and represent what the yearly volume would be if just that month's rate were applied to the entire year. These figures are also seasonally adjusted. The monthly percentage changes are always in between error margins (this month ±12.5%) and sales figures are almost always revised.
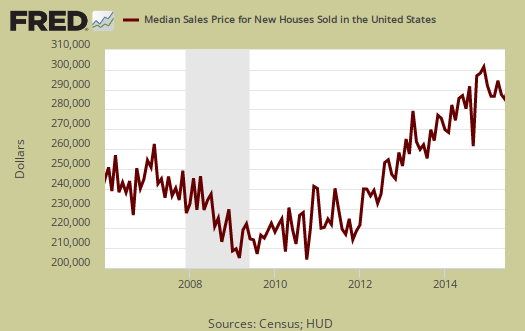
The June 2015 average home sale price was $328,700. This is a monthly decline of -2.1%. From a year ago the average price has changed -2.8%.

The median home price is $281,800 and had almost no change from the previous month. From June 2014, the median new home sales price has dropped by -1.8%. Median means half of new homes were sold below this price and both the average and median sales price for single family homes is not seasonally adjusted.
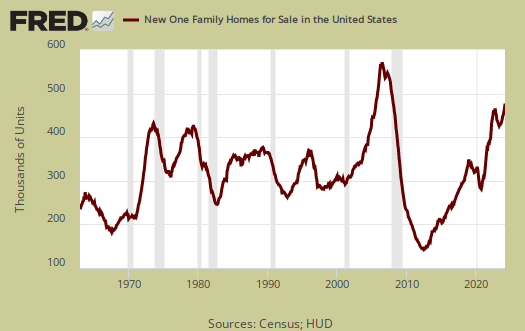
Inventories: New homes available for sale is now 215,000 units, a 3.4% increase from last month. From a year ago inventories have increased 8.6% and this is outside the ±5.8% margin of error. The monthly change is also outside the ±1.8% error margin.
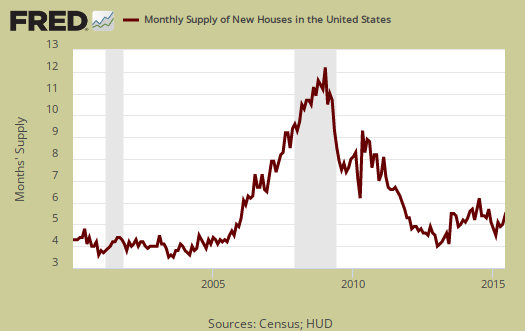
The graph below shows how long it would take to sell the new homes on the market at each month's sales rate. For June the time stands at 5.4 months. This is a 12.5% monthly change but with a -6.9% annual drop. Months decreasing mean the new homes sales market is tightening and heating up.
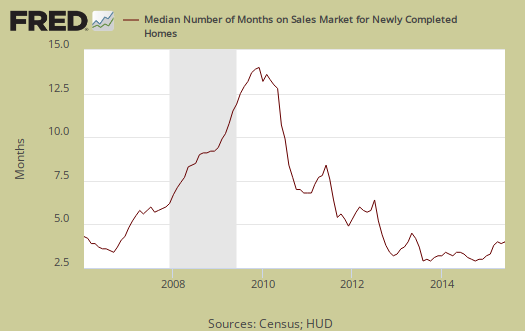
The median time a house was completed and on the market to the time it sold was 4.0 months. From a year ago that time period was 3.4 months. This implies the median time to move new properties is fairly stable.
Even after the housing bubble popped new home sales were in the 600 thousand range. The median price is way above 2006 levels. With wages stagnant we continue to wonder who is affording these homes. That said, rents are soaring as well.
A note on Census New Home Sales survey report: The variance in monthly housing sales statistics is so large, in part, due to the actual low volume overall, along with the fact this is a survey. One needs to look at least a quarter of time to get a real feel for new home sales, but a year of sales data is more in order. Additionally this report, due to it's huge margin of error, is almost always revised significantly the next month. Buyer beware on month to month comparisons and reacting to primarily figures and why we graph up the statistics so one can identify a real trend versus press headline buzz. The graphs show the trend much better than the monthly percentage changes.
The Census notes that the average revision is about 5% of the original reported. Here are our overviews of residential real estate statistics, only some graphs revised.
Recent comments