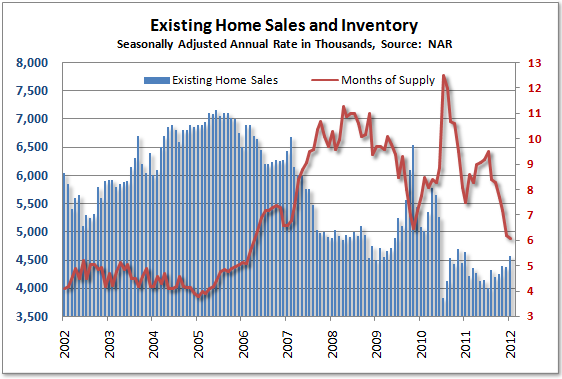
The National Association of Realtors' January 2012 existing home sales statistics show an annualized 4.3% monthly increase in total existing homes sales from December. Annualized gives what the yearly level and rate would be if the current month's rate was applied to an entire year. The change in existing home sales from this time last year was 0.7%.

graph: TMTGM
If January's pace lasted a year, there would be 4.57 million existing homes sold over a year's time. December's annualized level was revised downward to 4.38 million total homes. Total homes includes single family houses, condos, co-ops and townhomes.
Unsold inventory dropped from 6.4 months of supply to 6.1 months. This was a -0.4% change to a level of 2.31 million existing single family homes for sale on the market.
Total unsold listed inventory has trended down from a record 4.04 million in July 2007, and is 20.6 percent below a year ago.
The thing is, we know there are a backlog of foreclosures due to robo-signing and fraud stopping the process. While inventories maybe back to pre-recession levels, this level maybe temporary.
Additionally we have seen seasonal adjustments be a little skewed in housing data due to unusually warm weather in January.
The NAR makes a political statement, right in the middle of their report:
A government proposal to turn bank-owned properties into rentals on a large scale does not appear to be needed at this time.
Really? The 2011 Q4 homeowner vacancy rate was 2.4% and aren't foreclosures to increase by 25% in 2012? Below are details on all vacant housing units, including rentals, 2nd homes, vacation homes. In 2004, the homeowner vacancy rate was about 1.7%.
Approximately 86.1 percent of the housing units in the United States in the fourth quarter 2011 were occupied and 13.9 percent were vacant. Owner-occupied housing units made up 56.9 percent of total housing units, while renter-occupied units made up 29.3 percent of the inventory in the fourth quarter 2011. Vacant year-round units comprised 10.5 percent of total housing units, while 3.4 percent were for seasonal use.
Approximately 3.1 percent of the total units were for rent, 1.3 percent were for sale only, and 0.7 percent were rented or sold but not yet occupied. Vacant units that were held off market comprised 5.4 percent of the total housing stock. Of these units, 1.7 percent were for occasional use, 1.0 percent were temporarily occupied by persons with usual residence elsewhere (URE), and 2.7 percent were vacant for a variety of other reasons.
Look at the distressed home sales rate for January. Does that look healthy to you?
Distressed homes – foreclosures and short sales which sell at deep discounts – accounted for 35 percent of January sales (22 percent were foreclosures and 13 percent were short sales), up from 32 percent in December; they were 37 percent in January 2011.
All cash sales are 31% of total sales. So called investors snapped up 23% of the homes, up from 21% in December and at a rate the same as a year ago. In other words, 23% of these sales are not going to regular families, individuals but to bulk residential real estate speculators, home flippers and other commercial enterprise related activities.
First-time buyers rose to 33 percent of transactions in January from 31 percent in December; they were 29 percent in January 2011.
Contract failures are still at 33%. This is when the deal falls through.
Contract cancellations are unchanged from December but were only 9 percent in January 2011; they are caused largely by declined mortgage applications and failures in loan underwriting from appraisals coming in below the negotiated price.
Home prices actually dropped. The median price for all types of housing is now $154,700, a 2.0% drop from January 2011. Single family homes dropped 2.6% in price from a year ago, now at a median of $154,400. Condos are now $156,600, up 2.0%.
We take NAR statistics with a grain of salt due to the gun ho commentary contained within their statistical releases. Another site which pours over the housing statistics nitty gritty is Calculated Risk.

strange housing inventory hat tricks, good insight
Calculated Risk goes through some of the insights and his own on housing inventory here.
We caught the main one, foreclosures were postponed, in the above post. Housing inventory matters in terms of markets and 6 months is far away from 8 months in terms of price implications, recovery and such.
Not that we don't think housing prices need to still drop until they finally come into alignment with wages in the U.S. for the majority.