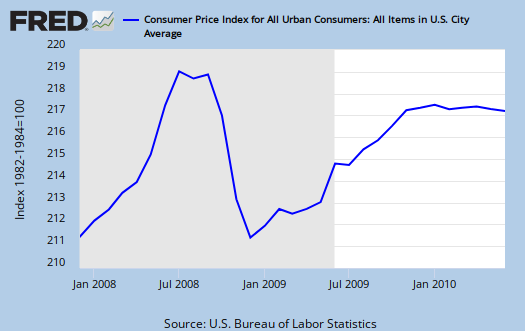
The Consumer Price Index for June 2010 declined -0.1% from last month. This is the 3rd month CPI has declined, -0.2% in May and April CPI decreased -0.1%. Core CPI increased +0.2%. This report is from the BLS website.

The drop was all energy, which declined -2.9%, the same drop as the last two months. In April, energy dropped -1.4%. Gas alone dropped -4.5%, last month was -5.2% (anybody else not seeing that at the pump?). Food, on the other hand, was unchanged, 0.0%, although eating your veggies just became cheaper, a drop of -1.3% this month. Not seasonally adjusted, CPI has risen 1.1% for the year, which is a drop on the average by 0.9% from last month.
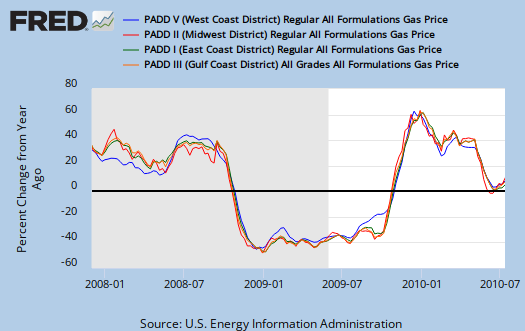
Fueling up your ride has increased 3.9% for the year (gas prices). Cheap computers (thank you China, oops I have no job with which to buy it?) are down -9.3% for the year. Education is up +4.8% for the year. Public transportation is up +10.9% for the year. Below is the percent change in regional regular gas prices from one year ago.

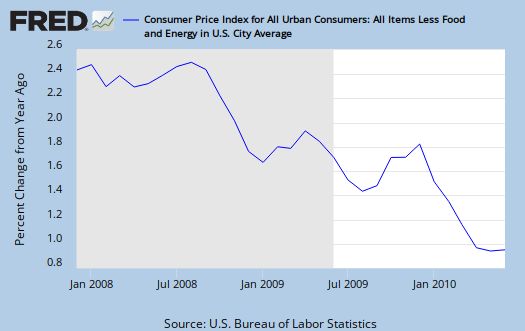
Look at the flatness of prices minus food and energy, or core CPI, a total yearly increase of +0.9%, which has been the same for the 3rd month in a row. Below is percent change from a year ago in core CPI.

The index for all items less food and energy rose 0.2 percent in June after rising 0.1 percent in May. The shelter index rose 0.1 percent in June, the same increase as last month. Within the shelter component, the rent index increased 0.1 percent in June. The index for owners’ equivalent rent also rose 0.1 percent, its first increase since August 2009, and the index for lodging away from home rose 1.3 percent. The apparel index increased 0.8 percent, and the index for used cars continued to increase, rising 0.9 percent.
The tobacco index rose 1.0 percent in June after increasing 1.3 percent in May. The index for new vehicles and recreation both rose slightly in June, increasing 0.1 percent. In contrast, the index for household furnishings and operations fell 0.4 percent in June, and the index for airline fares turned down, falling 0.6 percent after increasing in each of the previous three months.
Over the last 12 months, the index for all items less food and energy has risen 0.9 percent. Over that time period, the indexes for shelter, household furnishing and operations, apparel, recreation, and communication have posted decreases, while the indexes for used cars and trucks, medical care, new vehicles, tobacco, airline fares, and education have increased.
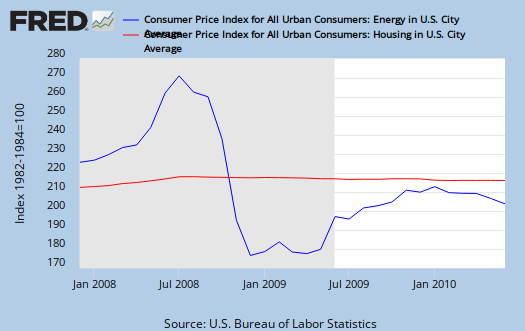
While housing is heavily weighted (obviously the biggest expense is shelter for most people), look at the two categories of energy vs. housing in the below graph. Housing is not just home prices, it's everything related to sheltering oneself. Shelter by itself increased +0.1%. Housing (including energy to heat it, stuff to put in it like a chair, and so on), dropped -0.1% for the month (flat).

Medical costs rose 0.3% this month. Unadjusted for the year, medical costs have risen +3.5%.
CPI-W increased 1.4% for the year. This index is used to calculate cost of living adjustments for social security.
Here is last month's report. This months report is here to look up individual categories of price changes.

Real Earnings for June
Read this paragraph:
From the BLS real earnings report.
So, 1+1 = 2 ? (0.1 - 0.1 ≠ 0.1)
Seriously, they are claiming earnings rose off of a -0.1% CPI decline yet also note wages decreased -0.1%?
Then, even though the average workweek hours declined -0.3%, they are claiming the average weekly pay was only -0.2% from this magical +0.1% increase in hourly earnings?
I have been almost yelled at on this site for analyzing government statistics and frankly this is probably round off error. But how can one issue a report with such an obviously flaw? Only the government can I guess.
Let's just say workers are getting paid crap and having their hours cut still. That about covers it.