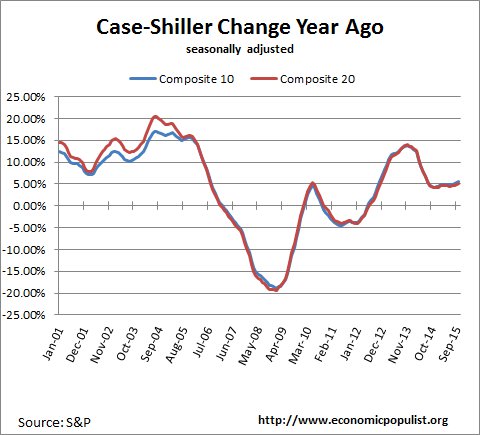
The October 2015 S&P Case Shiller home price index shows a seasonally adjusted 5.6% price increase from a year ago for the 20 metropolitan housing markets and a 5.1% yearly price increase in the top 10 housing markets. Home prices are still climbing over double the rate of inflation. The U.S. National Home Price Index increased 5.2% in October 2015. Since the price low of March 2012, the 10-City composite index has increased 34.9% and the 20-City composite index has increased 36.4%. From the housing bubble 2006 peaks, prices are now only down about 11-13%.
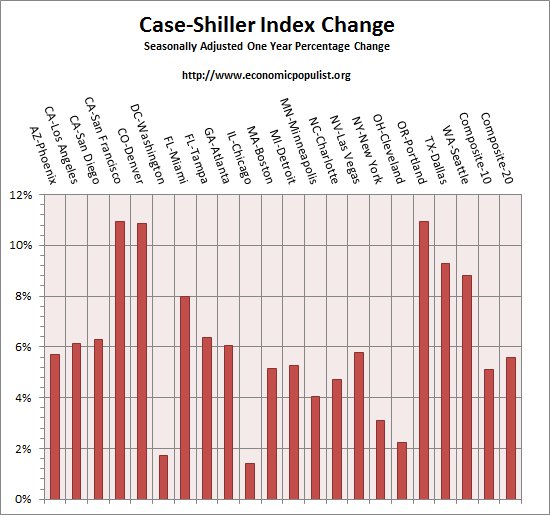
Below are all of the composite-20 index cities yearly price percentage change, using the seasonally adjusted data. San Francisco and Denver Colorado prices increased 10.9% from a year ago. Portland Oregon home prices are up by 11% from a year ago. No composite-10 or composite-20 annual price gains are negative using the seasonally adjusted data and only four housing markets in the composite 20 were below 4% annual gains. How can afford these homes as prices are so out of alignment with wages and salaries.
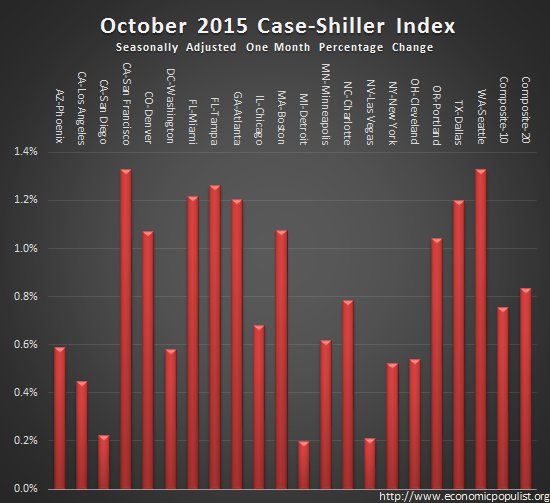
S&P reports the not seasonally adjusted data for their headlines. Housing is highly cyclical. Spring and early Summer are when most sales occur. For the month, the not seasonally adjusted composite-20 percentage change was 0.1% whereas the seasonally adjusted change for the composite-20 was 0.8%. The not seasonally adjusted composite-10 saw no change from last month, whereas the seasonally adjusted composite-10 showed a 0.8% increase. The below graph shows the seasonally adjusted monthly percentage change.
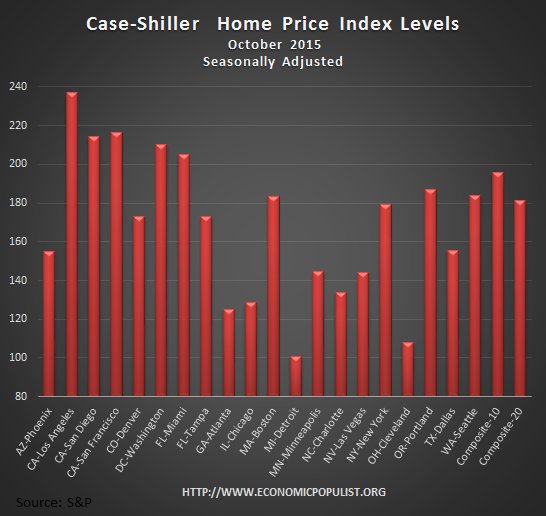
Case-shiller home price indices are normalized to the year 2000. The index value of 150 means single family housing prices have appreciated, or increased 50% since 2000 in that particular region. Case-Shiller indices are not adjusted for inflation. Below are the seasonally adjusted levels for the month.
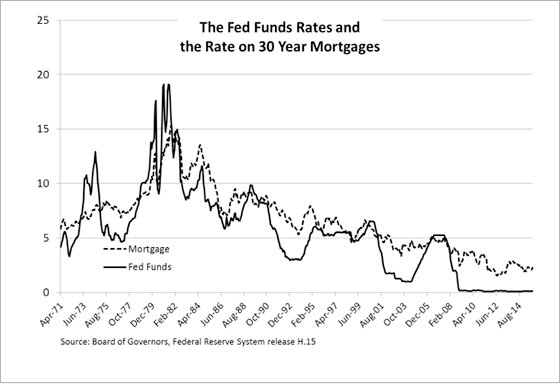
S&P publishes a national index for home prices which has increased 5.2% for the year. S&P also commented on the Federal Reserve raising rates and the historical impact on mortgage rates and gave a historical graph of the two:
The recent action by the Federal Reserve raising the Fed funds target rate by 25bp and spreading expectations of further increases during 2016 are leading some to wonder if mortgage interest rate might rise. Typically, increases in short term interest rates lead to smaller increases in long term interest rates. The chart below shows the average rate on 30-year fixed rate mortgages and the Fed funds rate. From May 2004 to July 2007, the Fed funds rate moved up from 1.0% to 5.25%; over the same period, the mortgage rate rose from about 6% to 6.75% during a sustained tightening effort by the Federal Reserve. The latest economic projections published by the Fed following the recent rate increase suggest that the Fed funds rate will be around 2.6% in September 2017 compared to a current rate of about 0.5%. These data suggest that potential home buyers need not fear runaway mortgage interest rates.
What we see with this latest report is the haves and have nots great economic divide continues unabated. It doesn't matter that wages and salaries are stagnant, that millions lost their homes in foreclosures, lost their jobs, lost their economic future. The great residential real estate ride continues because the powers that be need it to continue. Woe to the little guy for if the wheels come off this ride once again, one can bet they will be crushed while the one percent remain unscathed.
To Season or Not to Season, That is the Question:
The S&P/Case-Shiller Home Price Indices are calculated monthly using a three-month moving average and published with a two month lag. Their seasonal adjustment calculation is the standard used for all seasonal adjustments, the X-12 ARIMA, maintained by the Census. The headlines and Case-Shiler's report uses the not seasonally adjusted data. Not seasonally adjusted data can create more headline buzz on a month by month basis due to the seasonality of the housing market. S&P does make it clear that data should be compared to a year ago, to remove seasonal patterns, yet claims monthly percentage changes should use not seasonally adjusted indices and data. This seems more invalid than dealing with the statistical anomalies the massive housing bubble burst caused. Below is the seasonally adjusted and not seasonally adjusted Composite-20 Case-Shiller monthly index, for comparison's sake.

For more Information:
S&P does a great job of making the Case-Shiller data and details available for further information and analysis on their website.
Here is our Case-Shiller past overviews as well as the overviews of residential real estate statistics.

the problem with comparing three month indexes
the October indices compare prices of houses sold in August, September and October to those sold in July, August, and September, and hence the change in the month over month indexes are arithmetically equal to 1/3rd the difference between July home prices and October home prices, ie, not really a useful monthly change at all
this is also the case with any three month average, which we can represent by (a + b + c) / 3, with a being the current month, b being last month, and c being the month before that...another way of writing that same expression is "a/3 + b/3 + c/3 " when one compares that to the prior month, represented by (b + c + d) / 3, where d is the month before the month before last, we end up comparing (a/3 + b/3 + c/3) to (b/3 + c/3 + d/3), and since two of our elements in that comparison are identical, the comparison simply becomes a/3 to d/3, or one-third the difference between a and d... the trouble is, 3 month averages are used by economists everywhere as if they're providing some special insight...even the Chicago Fed elevates its three month average of the National Activity Index to the version that should be followed to remove volatility..so in the Chicago Fed National Activity Index (CFNAI) for November they end up comparing their August index to November, which is complete nonsense..
rjs