The S&P/Case-Shiller Home Price indexes for October 2010 were released today. The composite-10 index is down -1.2% for the month and the composite-20 index decreased -1.3%. For the year, the composite-10 index is 0.2% higher but the composite-20 is -0.8% lower than October 2009. Below are the 20 city and 10 city S&P/Case-Shiller monthly indices.

“The double-dip is almost here, as six cities set new lows for the period since the 2006 peaks. There is no good news in October’s report. Home prices across the country continue to fall.” says David M. Blitzer, Chairman of the Index Committee at Standard & Poor's. “The trends we have seen over the past few months have not changed. The tax incentives are over and the national economy remained lackluster in
October, the month covered by these data. Existing homes sales and housing starts have been reported for both October and November, and neither is giving any sense of optimism. On a year-over-year basis, sales are down more than 25% and the months’ supply of unsold homes is about 50% above where it was during the same months of last year. Housing starts are still hovering near 30-year lows. While delinquency rates might have seen some recent improvement, it is only on a relative basis. They are still well above their historic averages, in both the prime and sub-prime markets.
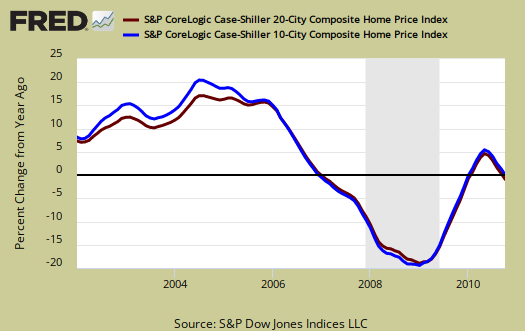
Below is the yearly percent change in the composite-10 and composite-20 Case-Shiller Indices. As you can see, there is clearly a new decline going on for 2010. This is what is meant by double-dip in declining home prices.

The above is dire news and how much a temporary halt of foreclosures due to foreclosuregate affected inventories and sales is unclear.
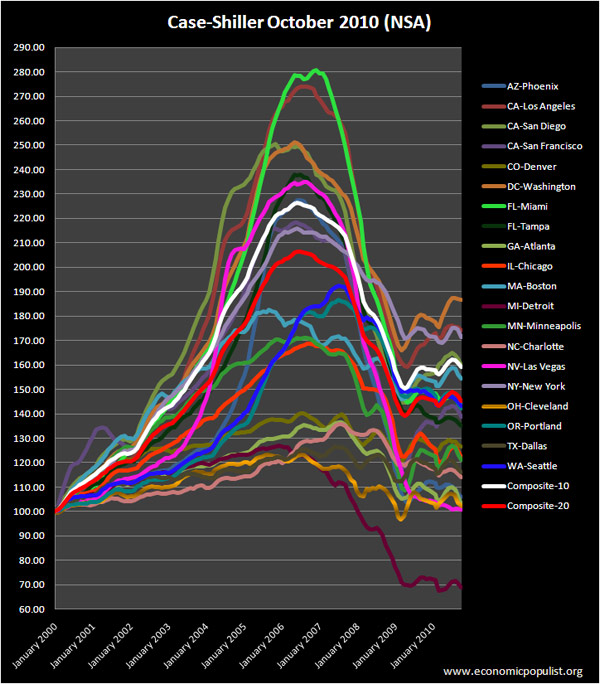
Graphed below are all of the cities of the composite-20 index. This should give a feel for the bubble and now current devaluations. Notice the stronger correlations in price declines to the unemployment rate for 2010, such as Detroit.

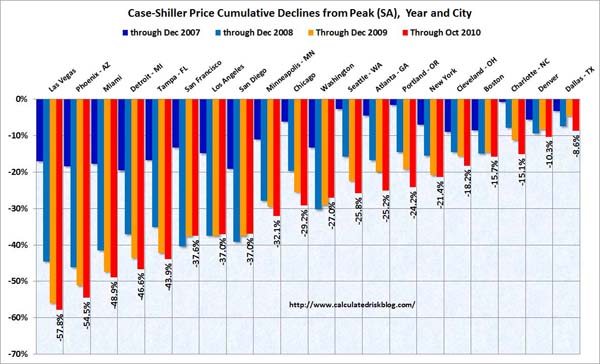
From the peak in 2006, now the 10 city index is down -29.7% and the 20 city index is down -29.6%. Nationally, prices are around the 2003 levels, with Detroit just being decimated. Six other cities are at new lows, Atlanta, Charlotte, Miami, Portland, Seattle and Tampa.
An October index level of 68.86 in Detroit indicates that average home prices are more than 30% below their January 2000 values. Las Vegas, Cleveland and Atlanta are just about back to their 2000 levels, with October prints of 100.97, 102.20 and 103.30, respectively. On a relative basis, Los Angeles, New York and Washington DC have fared best, retaining the most of their mid-2000 price appreciation. Each of these markets is more than 70% above their January 2000 levels.
Below is a very useful graph from Calculated Risk, showing how much prices have fallen from their peaks in the Composite-10 cities.

S&P does a great job of making data available for further information and analysis on their website.

Recent comments